 火柴人的Blog



SMA 均线交叉策略最优化研究 (2026-03-22)

SMA 均线交叉策略最优化研究
通过大规模参数搜索与回测,寻找 SMA 均线交叉策略在 A 股市场的最优参数组合,
并对比最优与最差策略的差异,揭示影响策略表现的关键因子。
发布于 2026-03-22 13<20> · 自动生成报告
研究概述
研究标的
| 代码 | 名称 | 类型 |
|---|---|---|
159915 | 创业板ETF | ETF |
510300 | 沪深300ETF | ETF |
510500 | 中证500ETF | ETF |
回测参数
| 参数 | 设定值 |
|---|---|
| 初始资金 | ¥200,000 |
| 回测区间 | 2013-01-01 ~ 2026-03-19 |
| 因子组合数 | 全量笛卡尔积 (去重后) |
| 评价主指标 | 年化收益率 |
| 交易模式 | 纯多头 (Long Only) |
因子空间设计
| 因子 | 说明 | 候选值 |
|---|---|---|
sma_short | 短期均线周期 | [10, 15, 20] |
sma_long | 长期均线周期 | [30, 50, 60, 120] |
rv_window | 相对波动率窗口 | [10, 20, 30] |
rv_threshold | RV 过滤阈值 | [1.0, 1.5, 2.0, 2.5] |
bias_enabled | 是否启用乖离率 | [True, False] |
bias_window | 乖离率周期 | [5, 10, 20] |
bias_upper | 乖离率上阈值 (%) | [3.0, 5.0, 8.0] |
bias_lower | 乖离率下阈值 (%) | [-3.0, -5.0, -8.0] |
enable_atr | 是否启用ATR止损 | [True, False] |
atr_stop_multiplier | ATR 止损倍数 | [1.5, 2.0, 2.5, 3.0] |
enable_adx | 是否启用ADX过滤 | [True, False] |
adx_threshold | ADX 阈值 | [20, 25, 30] |
position_mode | 仓位管理模式 | ['fixed', 'atr', 'volatility'] |
position_base | 基础仓位比例 | [0.6, 0.8, 1.0] |
创业板ETF (159915) 策略分析
全局统计
| 指标 | 数值 |
|---|---|
| 有效组合数 | 725760 |
| 正收益组合 | 201909 (27.8%) |
| 年化收益率范围 | -6.80% ~ 17.50% |
| 年化收益率中位数 | -0.27% |
| 年化收益率均值 | -0.04% |
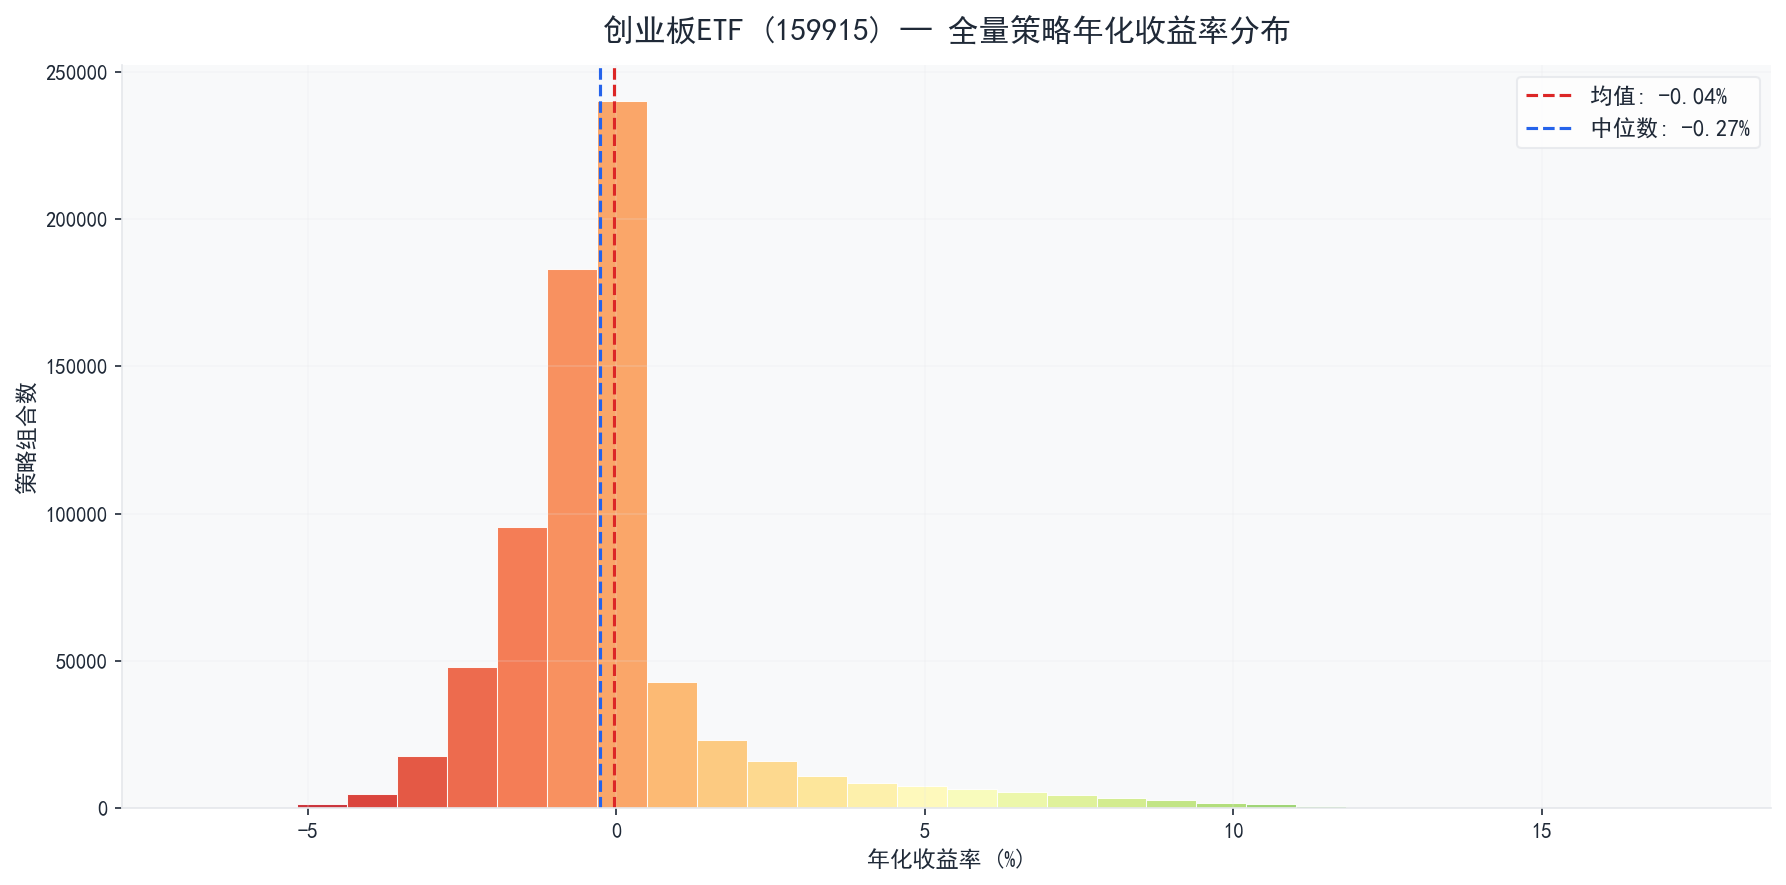
▲ 收益分布
Top 5 最优策略
表现最好的 5 组参数组合:
| 排名 | 年化收益 | Alpha | 基准年化 | 最大回撤 | 夏普比率 | 胜率 | 年均交易 | ATR | ADX | BIAS |
|---|---|---|---|---|---|---|---|---|---|---|
| 1 | 17.50% | +4.52% | 12.98% | 40.98% | 0.652 | 52.5% | 4.8 | ✓ | ✗ | ✗ |
| 2 | 17.26% | +4.27% | 12.98% | 42.51% | 0.649 | 51.7% | 4.7 | ✓ | ✗ | ✗ |
| 3 | 17.22% | +4.23% | 12.98% | 45.14% | 0.648 | 49.2% | 4.8 | ✓ | ✗ | ✗ |
| 4 | 16.98% | +3.99% | 12.98% | 46.56% | 0.644 | 48.3% | 4.7 | ✓ | ✗ | ✗ |
| 5 | 16.85% | +3.87% | 12.98% | 42.99% | 0.622 | 52.5% | 4.8 | ✓ | ✗ | ✗ |
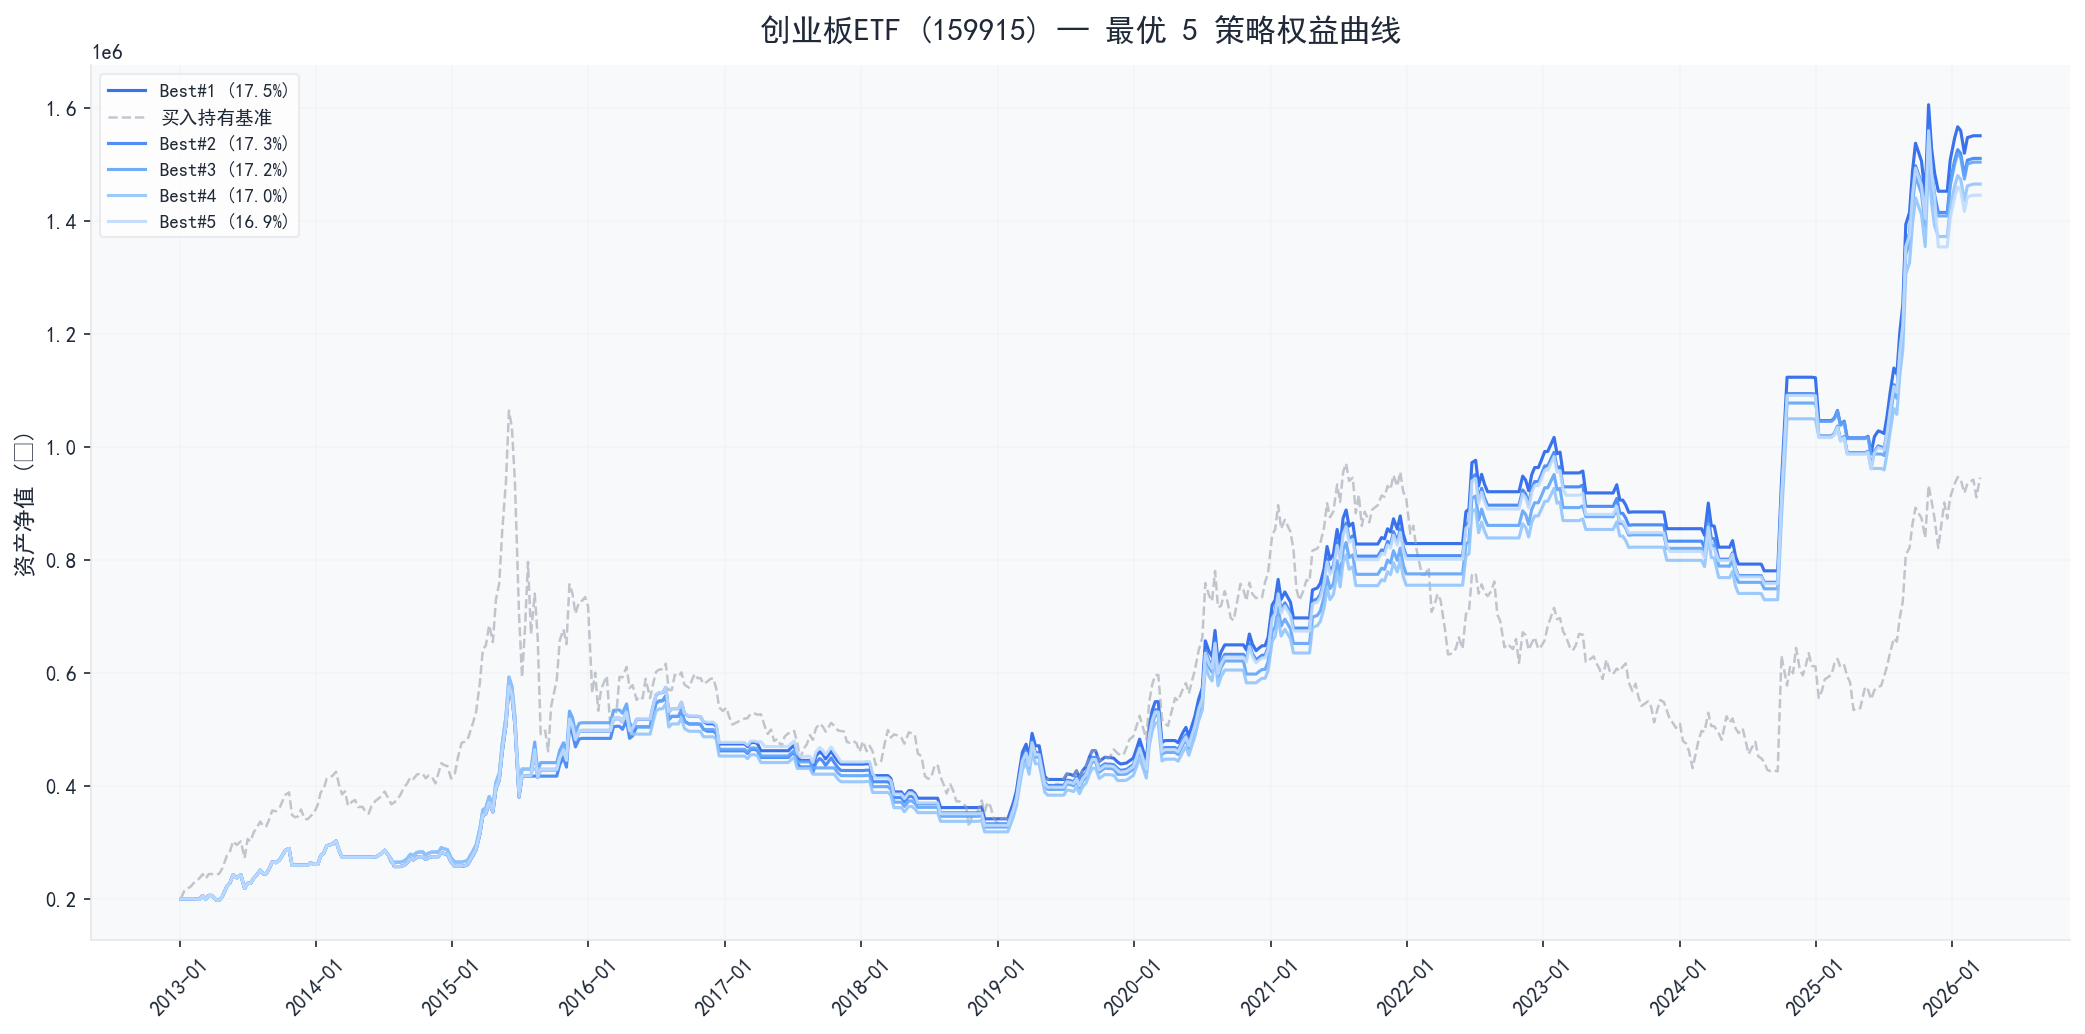
▲ 最优策略权益曲线
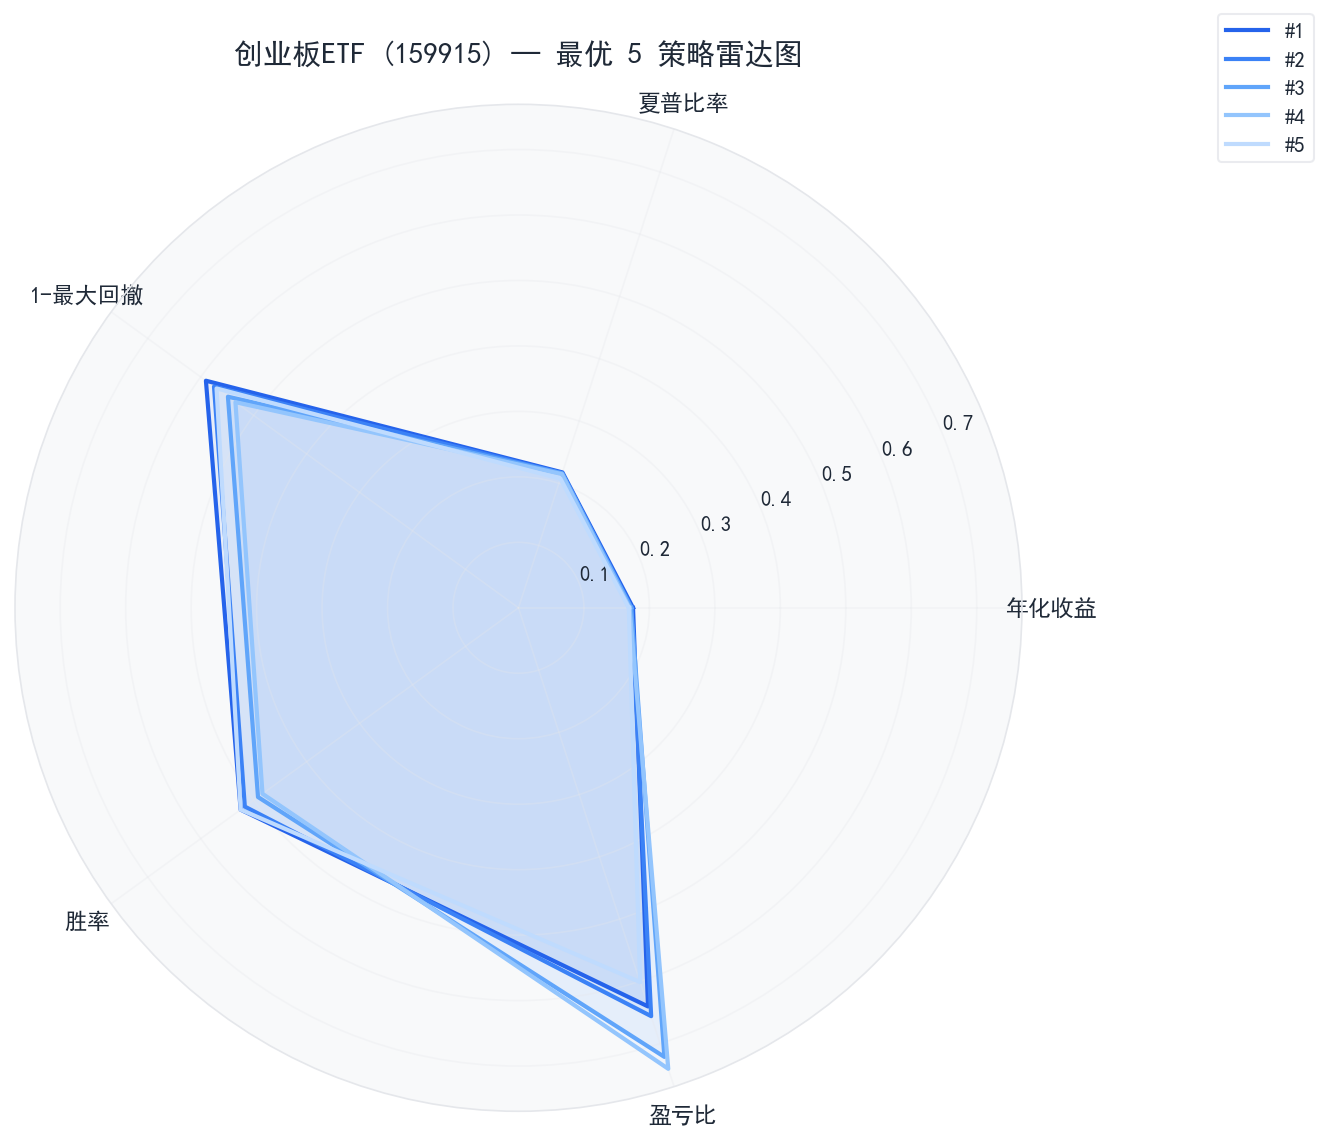
▲ 最优策略雷达图
Top 5 参数详情
- #1 — 年化 17.50% · 夏普 0.652 · 回撤 40.98%
{ "sma_long": 30, "rv_window": 10, "sma_short": 20, "bias_lower": -3.0, "bias_upper": 3.0, "enable_adx": false, "enable_atr": true, "start_year": 2013, "bias_window": 5, "bias_enabled": false, "rv_threshold": 2.5, "adx_threshold": 20, "position_base": 1.0, "position_mode": "fixed", "atr_stop_multiplier": 2.0}短期均线(20日)×月线级别(30日);严格波动率过滤;BIAS关;ATR止损×2.0;ADX关;固定仓位(100%)
- #2 — 年化 17.26% · 夏普 0.649 · 回撤 42.51%
{ "sma_long": 30, "rv_window": 20, "sma_short": 20, "bias_lower": -3.0, "bias_upper": 3.0, "enable_adx": false, "enable_atr": true, "start_year": 2013, "bias_window": 5, "bias_enabled": false, "rv_threshold": 2.0, "adx_threshold": 20, "position_base": 1.0, "position_mode": "fixed", "atr_stop_multiplier": 2.0}短期均线(20日)×月线级别(30日);较高波动率过滤;BIAS关;ATR止损×2.0;ADX关;固定仓位(100%)
- #3 — 年化 17.22% · 夏普 0.648 · 回撤 45.14%
{ "sma_long": 30, "rv_window": 10, "sma_short": 20, "bias_lower": -3.0, "bias_upper": 3.0, "enable_adx": false, "enable_atr": true, "start_year": 2013, "bias_window": 5, "bias_enabled": false, "rv_threshold": 2.5, "adx_threshold": 20, "position_base": 1.0, "position_mode": "fixed", "atr_stop_multiplier": 1.5}短期均线(20日)×月线级别(30日);严格波动率过滤;BIAS关;ATR止损×1.5;ADX关;固定仓位(100%)
- #4 — 年化 16.98% · 夏普 0.644 · 回撤 46.56%
{ "sma_long": 30, "rv_window": 20, "sma_short": 20, "bias_lower": -3.0, "bias_upper": 3.0, "enable_adx": false, "enable_atr": true, "start_year": 2013, "bias_window": 5, "bias_enabled": false, "rv_threshold": 2.0, "adx_threshold": 20, "position_base": 1.0, "position_mode": "fixed", "atr_stop_multiplier": 1.5}短期均线(20日)×月线级别(30日);较高波动率过滤;BIAS关;ATR止损×1.5;ADX关;固定仓位(100%)
- #5 — 年化 16.85% · 夏普 0.622 · 回撤 42.99%
{ "sma_long": 30, "rv_window": 10, "sma_short": 20, "bias_lower": -3.0, "bias_upper": 3.0, "enable_adx": false, "enable_atr": true, "start_year": 2013, "bias_window": 5, "bias_enabled": false, "rv_threshold": 2.5, "adx_threshold": 20, "position_base": 1.0, "position_mode": "fixed", "atr_stop_multiplier": 2.5}短期均线(20日)×月线级别(30日);严格波动率过滤;BIAS关;ATR止损×2.5;ADX关;固定仓位(100%)
Bottom 5 最差策略
表现最差的 5 组参数组合:
| 排名 | 年化收益 | Alpha | 基准年化 | 最大回撤 | 夏普比率 | 胜率 | 年均交易 | ATR | ADX | BIAS |
|---|---|---|---|---|---|---|---|---|---|---|
| 1 | -6.80% | -19.78% | 12.98% | 59.10% | -0.774 | 16.7% | 0.9 | ✗ | ✓ | ✗ |
| 2 | -6.80% | -19.78% | 12.98% | 59.10% | -0.774 | 16.7% | 0.9 | ✗ | ✓ | ✓ |
| 3 | -6.80% | -19.78% | 12.98% | 59.10% | -0.774 | 16.7% | 0.9 | ✗ | ✓ | ✓ |
| 4 | -6.80% | -19.78% | 12.98% | 59.10% | -0.774 | 16.7% | 0.9 | ✗ | ✓ | ✓ |
| 5 | -6.62% | -19.60% | 12.98% | 59.60% | -0.853 | 11.1% | 0.7 | ✗ | ✓ | ✗ |
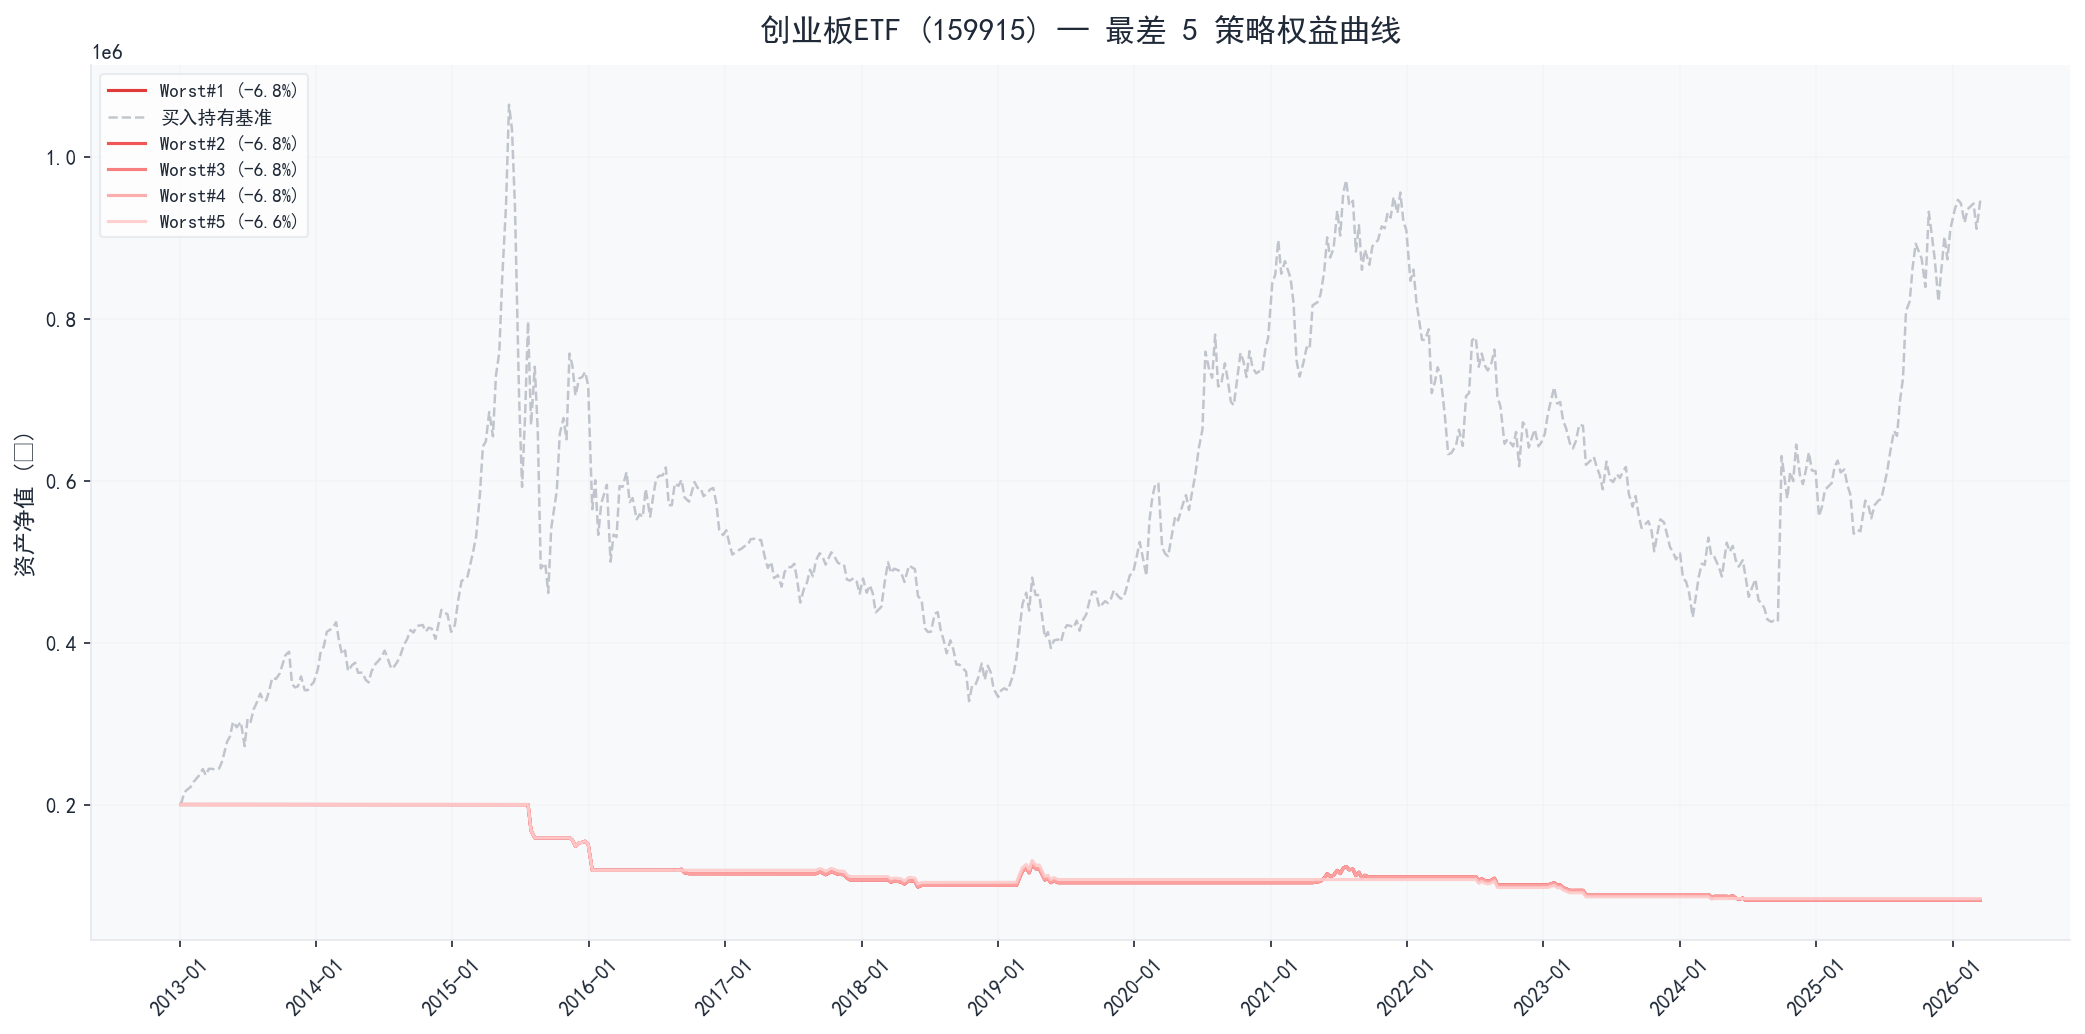
▲ 最差策略权益曲线
Bottom 5 参数详情
- #1 — 年化 -6.80% · 夏普 -0.774 · 回撤 59.10%
{ "sma_long": 120, "rv_window": 10, "sma_short": 10, "bias_lower": -3.0, "bias_upper": 3.0, "enable_adx": true, "enable_atr": false, "start_year": 2013, "bias_window": 5, "bias_enabled": false, "rv_threshold": 2.5, "adx_threshold": 20, "position_base": 1.0, "position_mode": "fixed", "atr_stop_multiplier": 1.5}短期均线(10日)×半年线(120日);严格波动率过滤;BIAS关;ATR止损关;ADX>20;固定仓位(100%)
- #2 — 年化 -6.80% · 夏普 -0.774 · 回撤 59.10%
{ "sma_long": 120, "rv_window": 10, "sma_short": 10, "bias_lower": -8.0, "bias_upper": 8.0, "enable_adx": true, "enable_atr": false, "start_year": 2013, "bias_window": 5, "bias_enabled": true, "rv_threshold": 2.5, "adx_threshold": 20, "position_base": 1.0, "position_mode": "fixed", "atr_stop_multiplier": 1.5}短期均线(10日)×半年线(120日);严格波动率过滤;BIAS[-8.0%,8.0%];ATR止损关;ADX>20;固定仓位(100%)
- #3 — 年化 -6.80% · 夏普 -0.774 · 回撤 59.10%
{ "sma_long": 120, "rv_window": 10, "sma_short": 10, "bias_lower": -5.0, "bias_upper": 8.0, "enable_adx": true, "enable_atr": false, "start_year": 2013, "bias_window": 5, "bias_enabled": true, "rv_threshold": 2.5, "adx_threshold": 20, "position_base": 1.0, "position_mode": "fixed", "atr_stop_multiplier": 1.5}短期均线(10日)×半年线(120日);严格波动率过滤;BIAS[-5.0%,8.0%];ATR止损关;ADX>20;固定仓位(100%)
- #4 — 年化 -6.80% · 夏普 -0.774 · 回撤 59.10%
{ "sma_long": 120, "rv_window": 10, "sma_short": 10, "bias_lower": -3.0, "bias_upper": 8.0, "enable_adx": true, "enable_atr": false, "start_year": 2013, "bias_window": 5, "bias_enabled": true, "rv_threshold": 2.5, "adx_threshold": 20, "position_base": 1.0, "position_mode": "fixed", "atr_stop_multiplier": 1.5}短期均线(10日)×半年线(120日);严格波动率过滤;BIAS[-3.0%,8.0%];ATR止损关;ADX>20;固定仓位(100%)
- #5 — 年化 -6.62% · 夏普 -0.853 · 回撤 59.60%
{ "sma_long": 120, "rv_window": 10, "sma_short": 10, "bias_lower": -3.0, "bias_upper": 3.0, "enable_adx": true, "enable_atr": false, "start_year": 2013, "bias_window": 5, "bias_enabled": false, "rv_threshold": 2.5, "adx_threshold": 25, "position_base": 1.0, "position_mode": "fixed", "atr_stop_multiplier": 1.5}短期均线(10日)×半年线(120日);严格波动率过滤;BIAS关;ATR止损关;ADX>25;固定仓位(100%)
Best vs Worst 对比分析
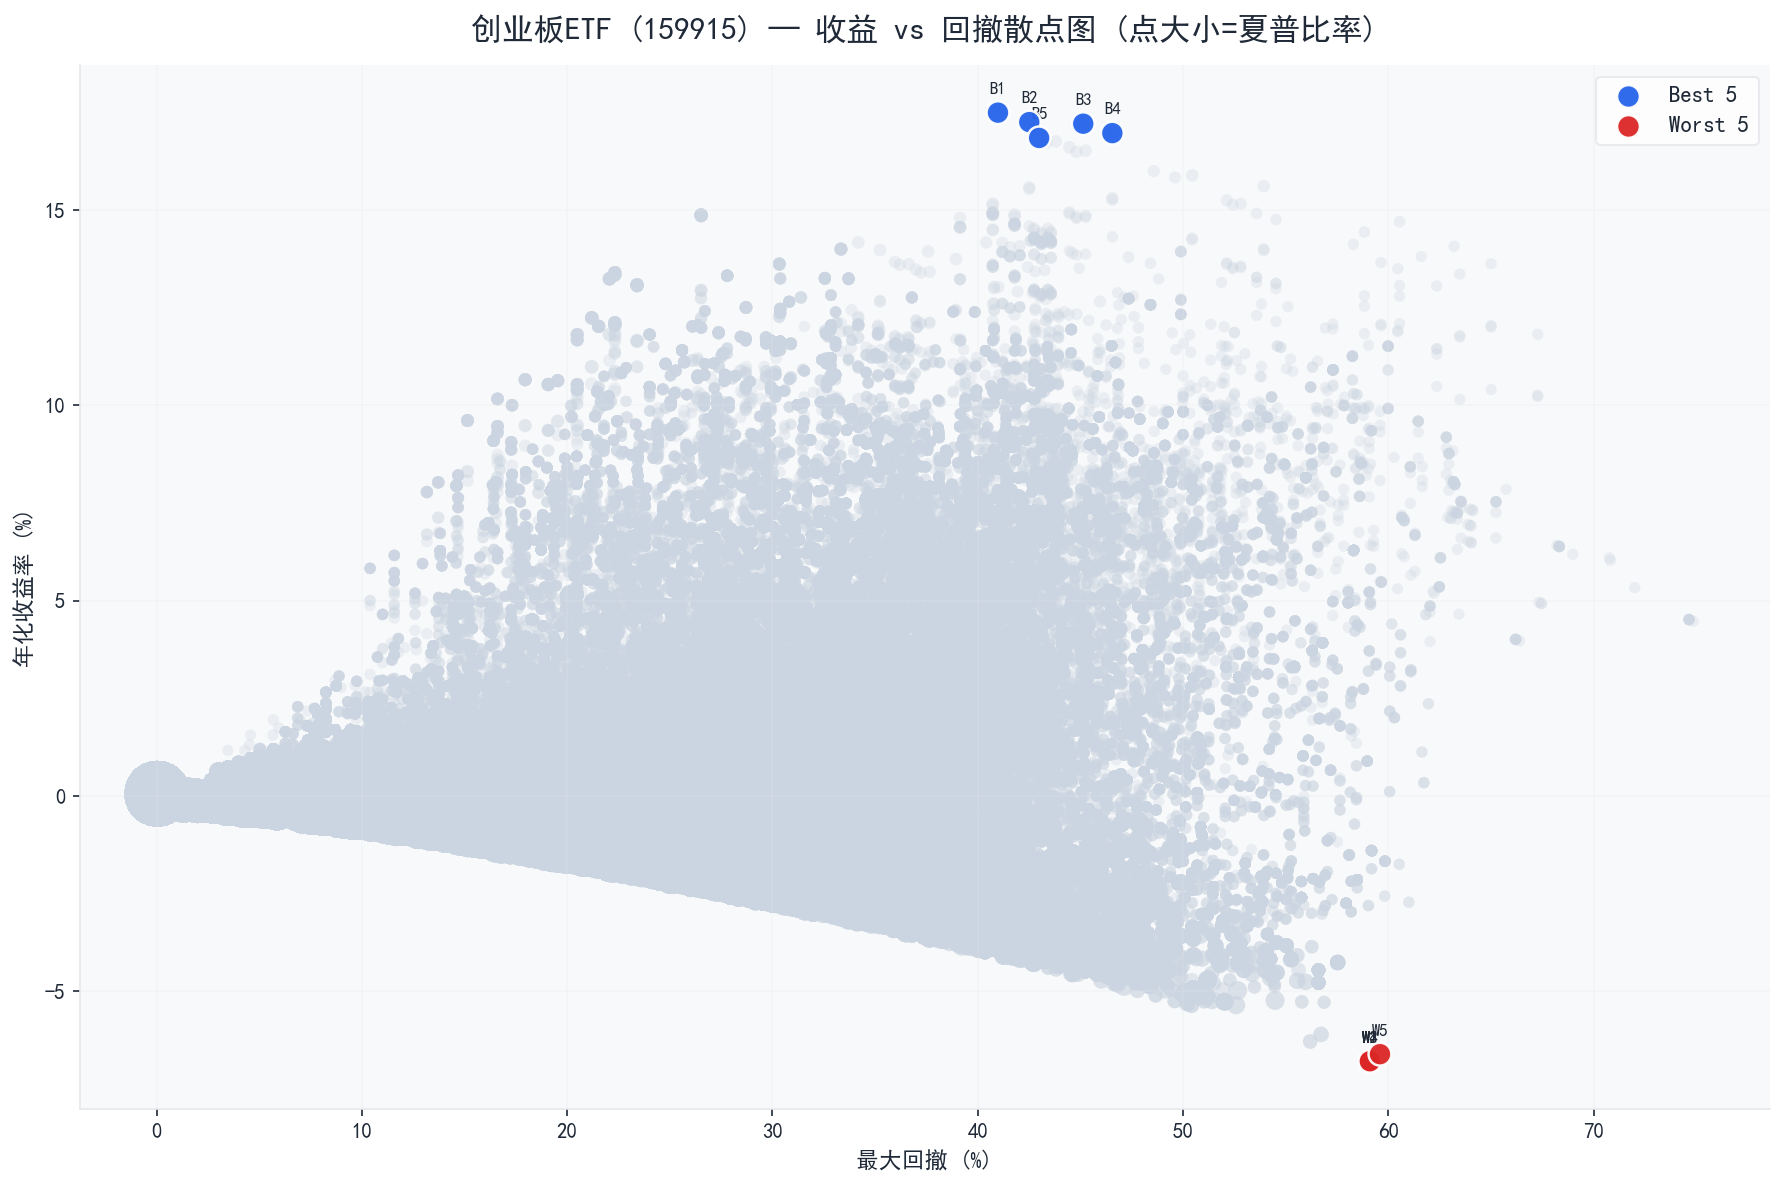
▲ 收益-回撤散点图
| 指标 | Best 5 均值 | Worst 5 均值 | 差异 |
|---|---|---|---|
| 年化收益率 | 17.16% | -6.76% | +23.92% |
| 夏普比率 | 0.643 | -0.790 | +1.433 |
| 最大回撤 | 43.64% | 59.20% | -15.57% |
| 胜率 | 50.8% | 15.6% | +35.3% |
因子敏感度分析
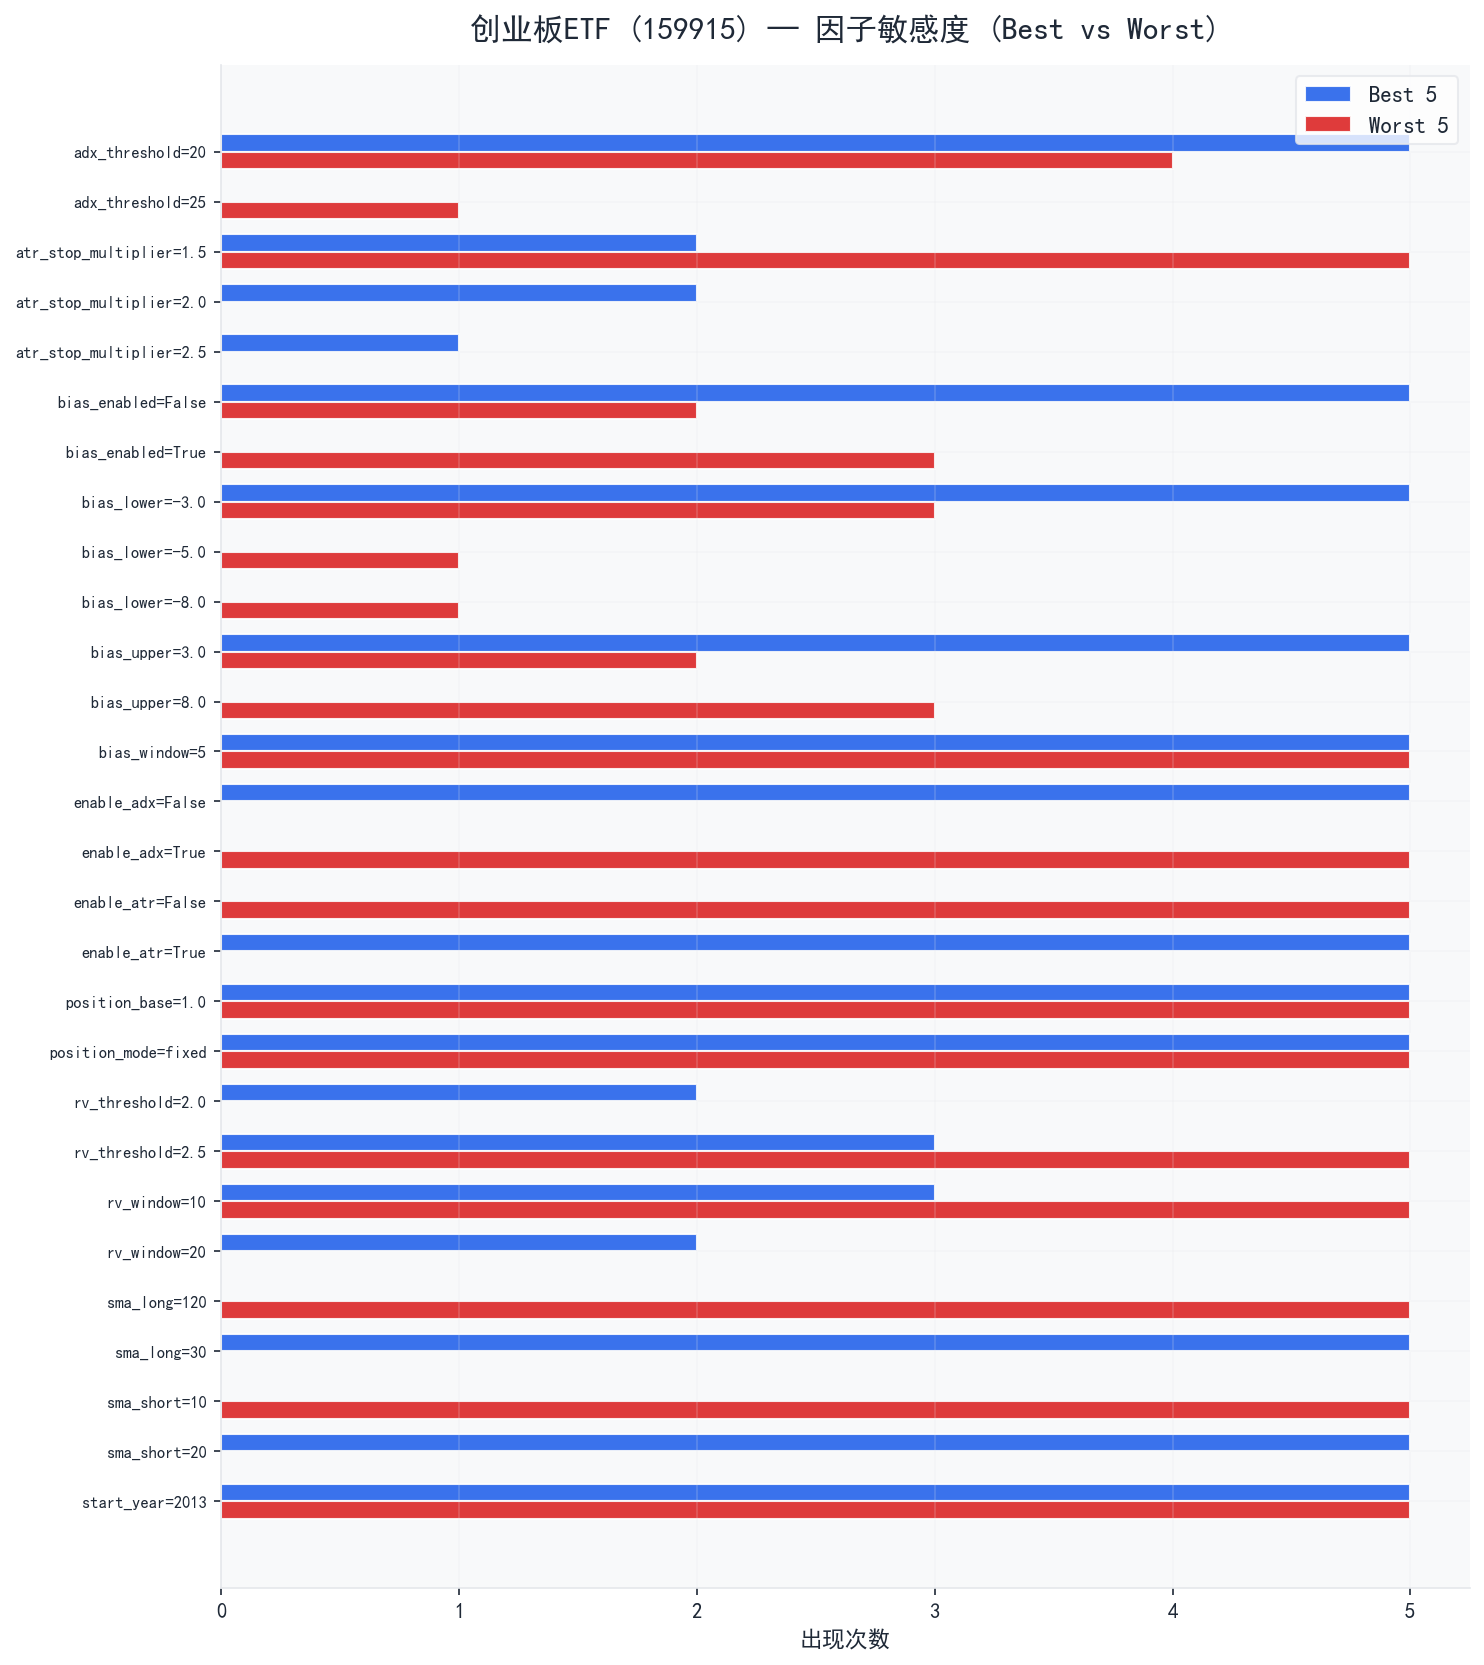
▲ 因子敏感度 最优与最差策略的因子差异:
atr_stop_multiplier: 最优策略偏好2.0,最差策略偏好1.5bias_enabled: 最优策略偏好False,最差策略偏好Truebias_upper: 最优策略偏好3.0,最差策略偏好8.0enable_adx: 最优策略偏好False,最差策略偏好Trueenable_atr: 最优策略偏好True,最差策略偏好Falsesma_long: 最优策略偏好30,最差策略偏好120sma_short: 最优策略偏好20,最差策略偏好10
最优策略交易信号
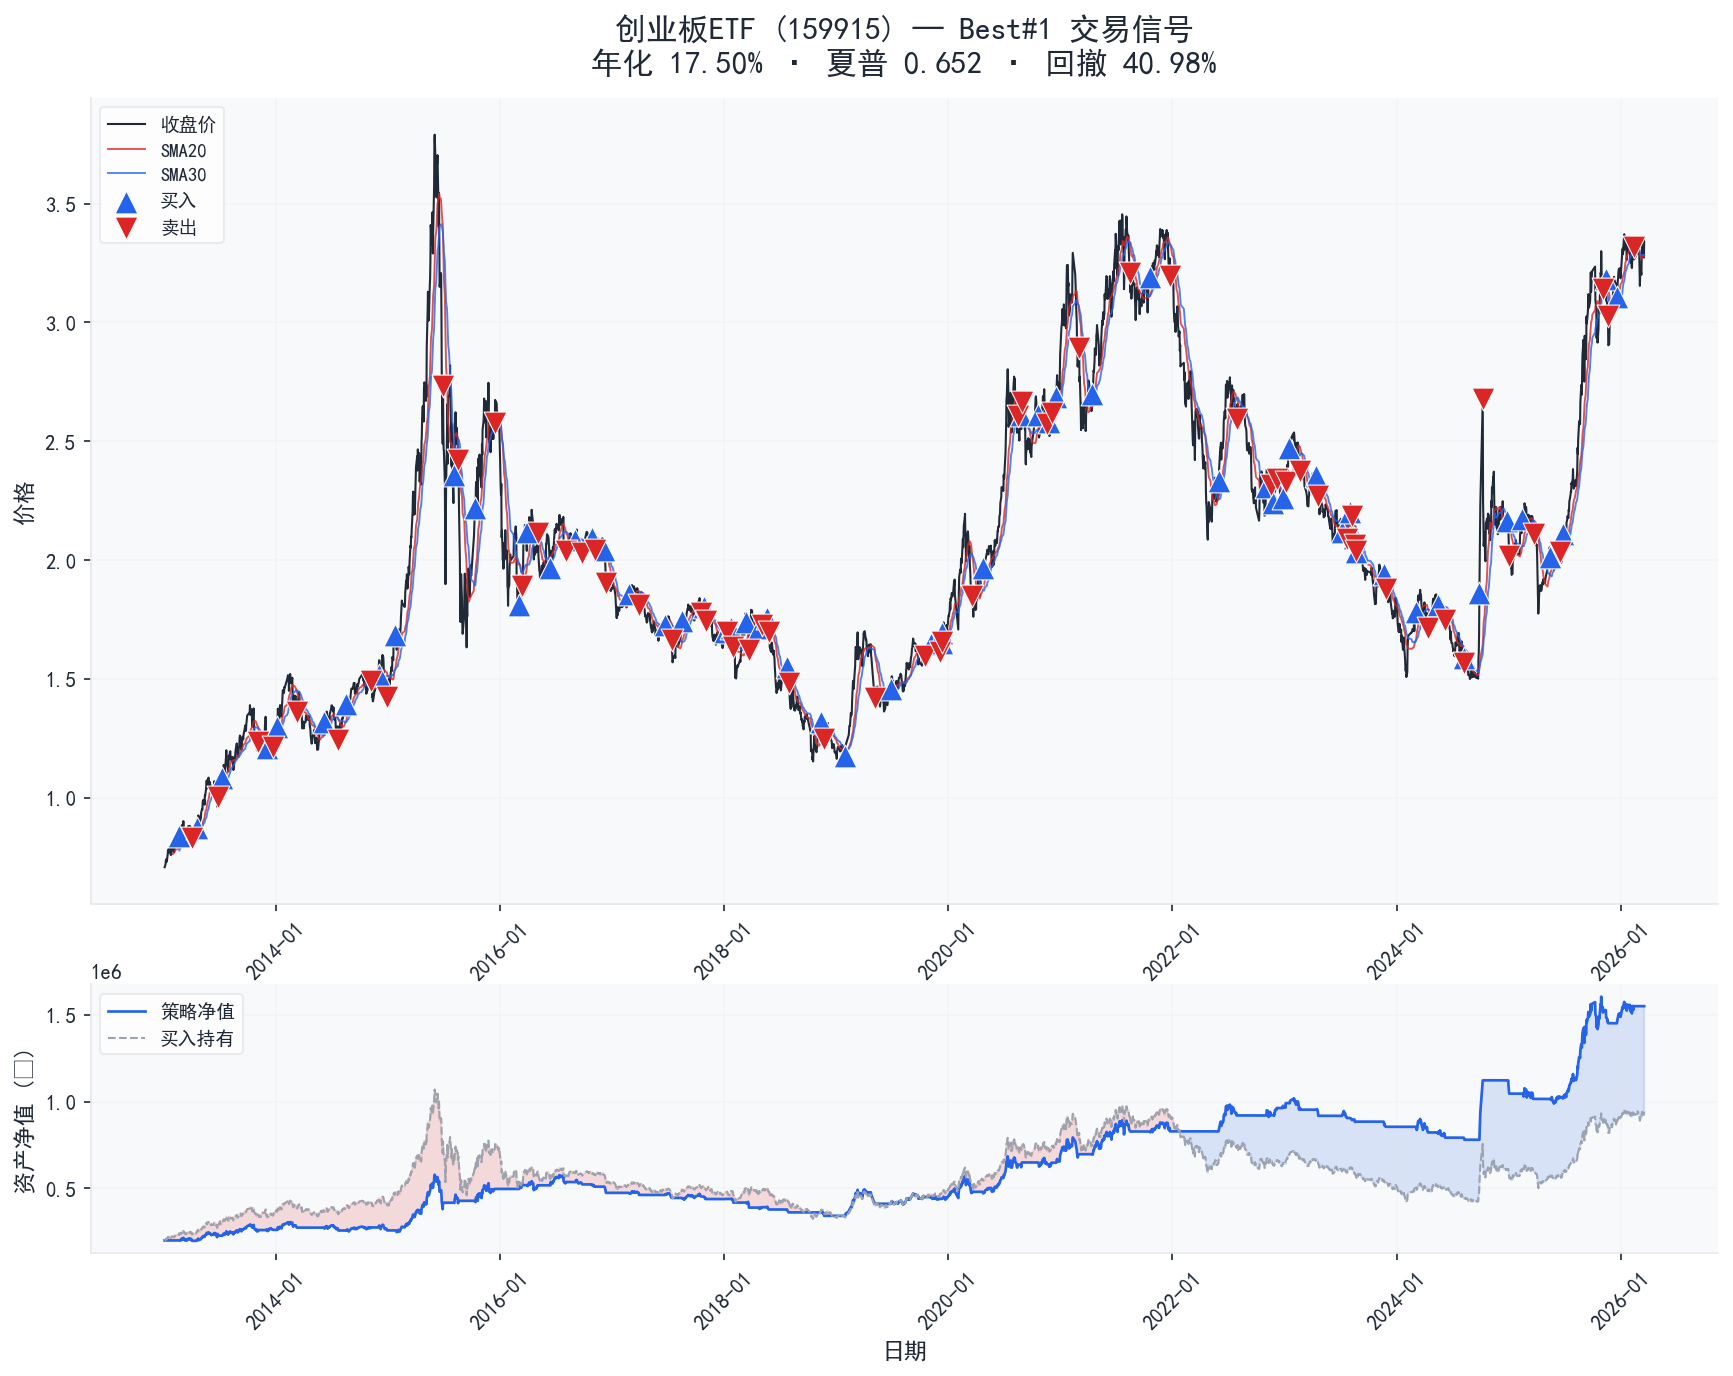
▲ 交易信号K线图
乖离率 vs 无乖离率 对比分析
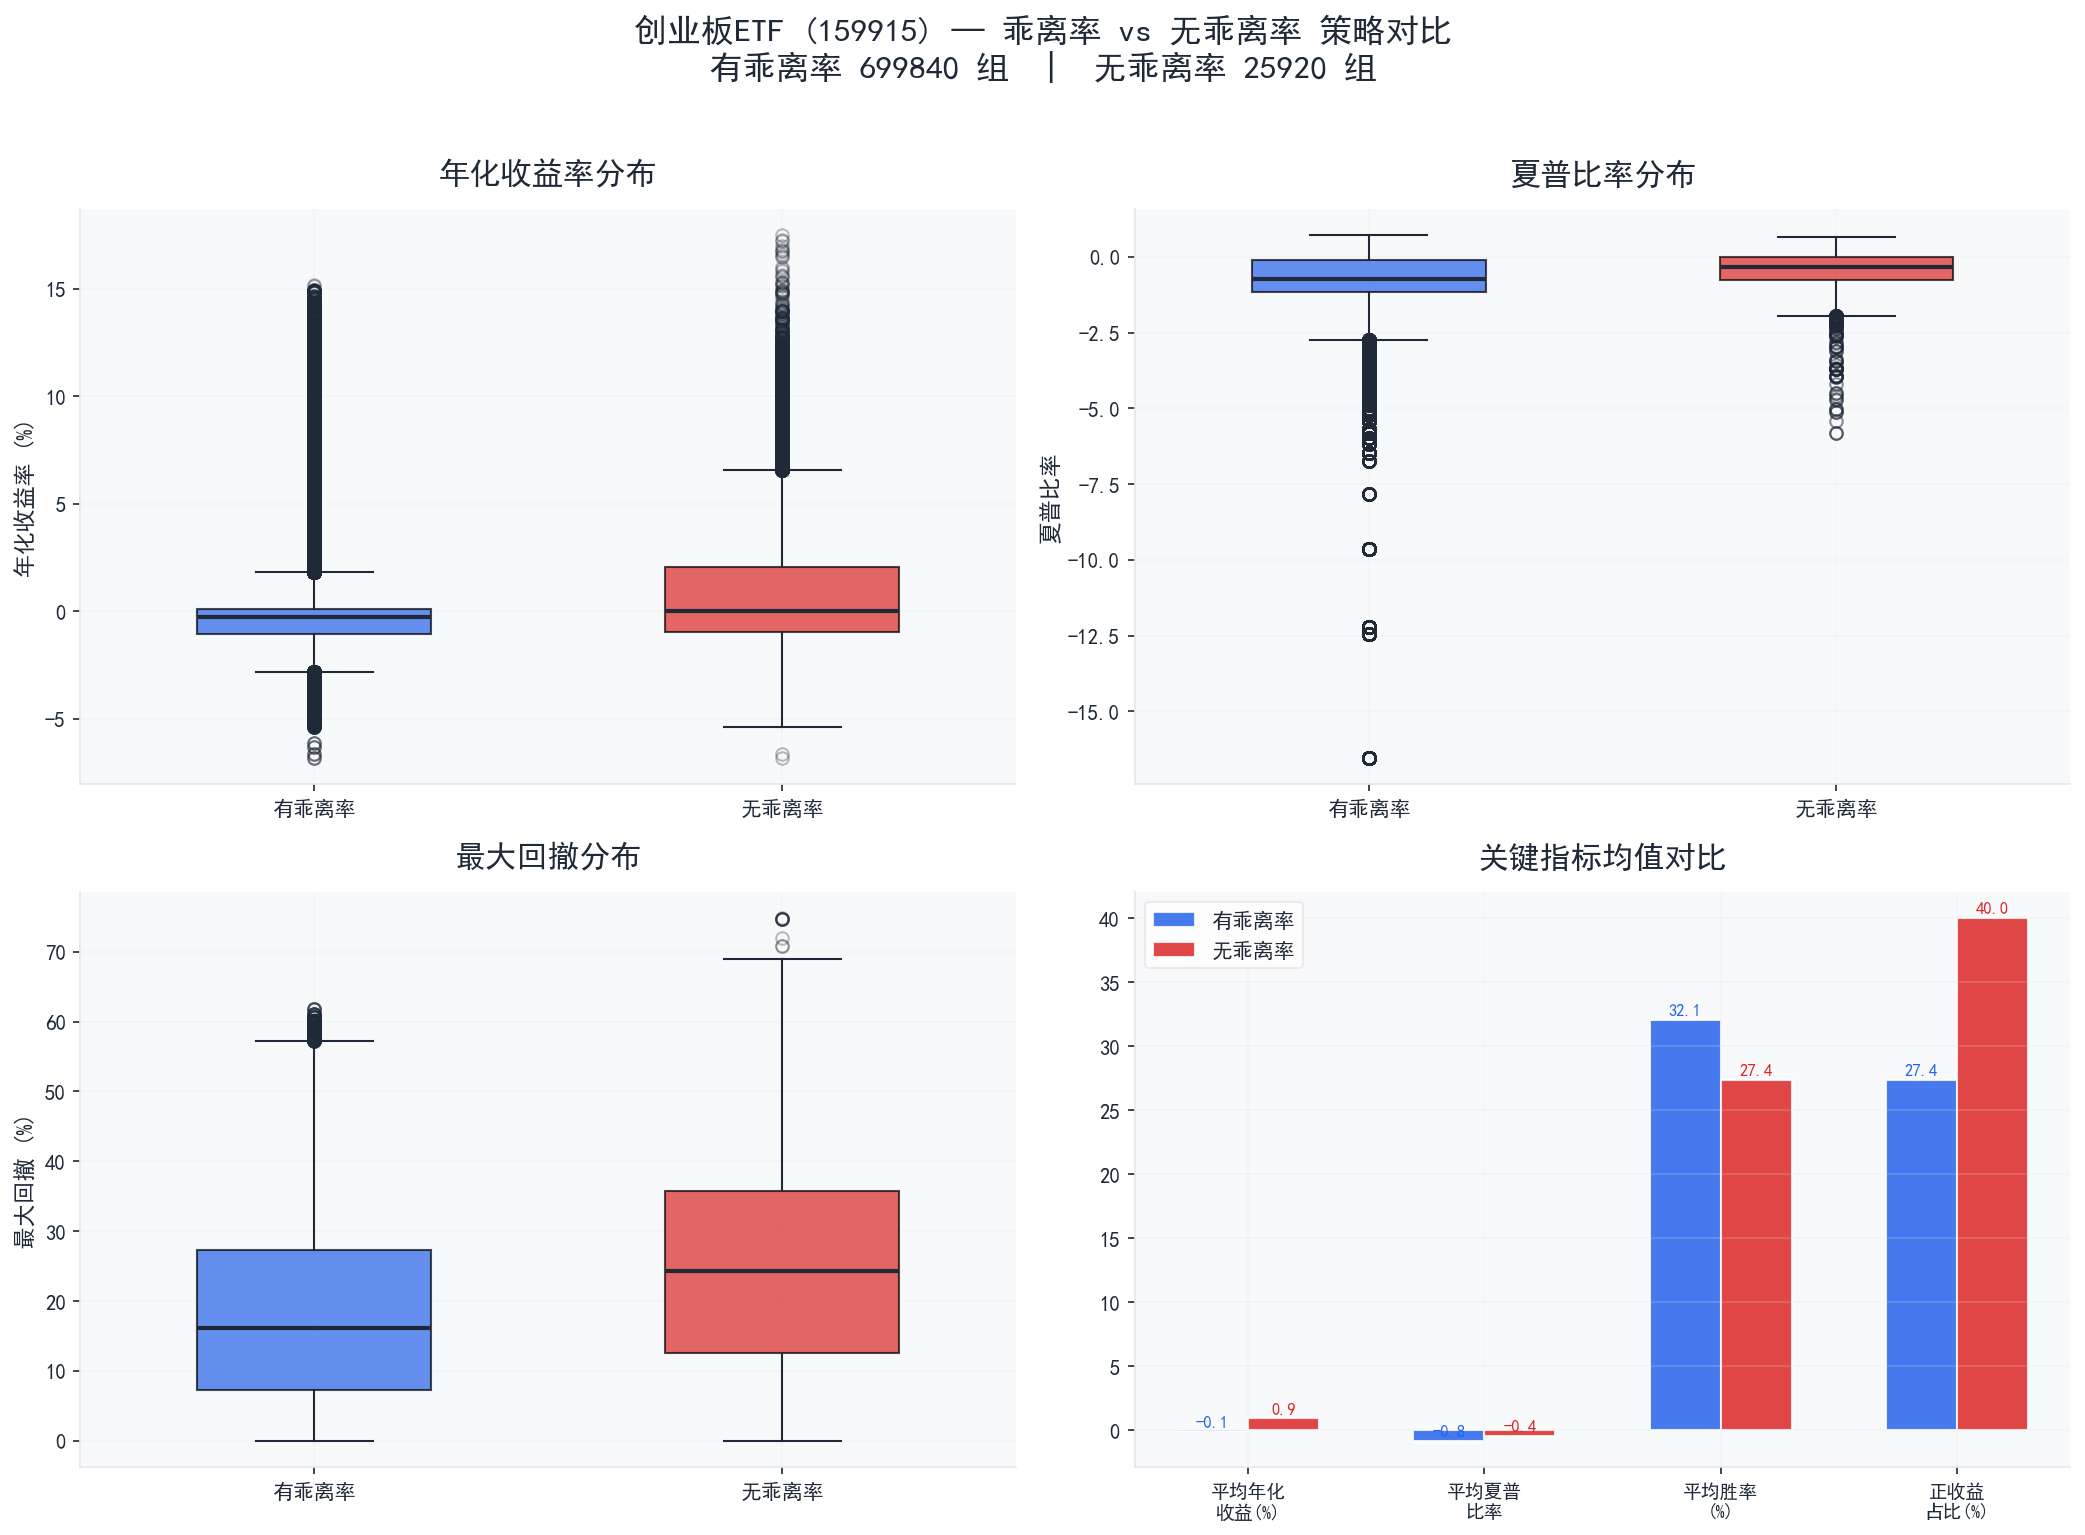
▲ 乖离率对比
| 指标 | 有乖离率 | 无乖离率 | 差异 |
|---|---|---|---|
| 组合数 | 699840 | 25920 | — |
| 平均年化收益 | -0.08% | 0.94% | -1.01% |
| 中位数年化收益 | -0.28% | 0.00% | -0.28% |
| 最高年化收益 | 15.17% | 17.50% | -2.33% |
| 平均夏普比率 | -0.803 | -0.405 | -0.398 |
| 平均最大回撤 | 17.69% | 24.29% | -6.59% |
| 平均胜率 | 32.1% | 27.4% | +4.7% |
| 正收益占比 | 27.4% | 40.0% | -12.7% |
| 平均交易次数 | 12.4 | 15.0 | -2.6 |
分析结论:
- 无乖离率组平均年化收益高出 1.01%,说明乖离率过滤可能过于保守,错失部分行情
- 有乖离率组平均回撤低 6.59%,乖离率在风控方面发挥了积极作用
- 无乖离率组风险调整后收益更优,夏普比率高出 0.398
模块消融分析 (ATR止损 × ADX过滤)
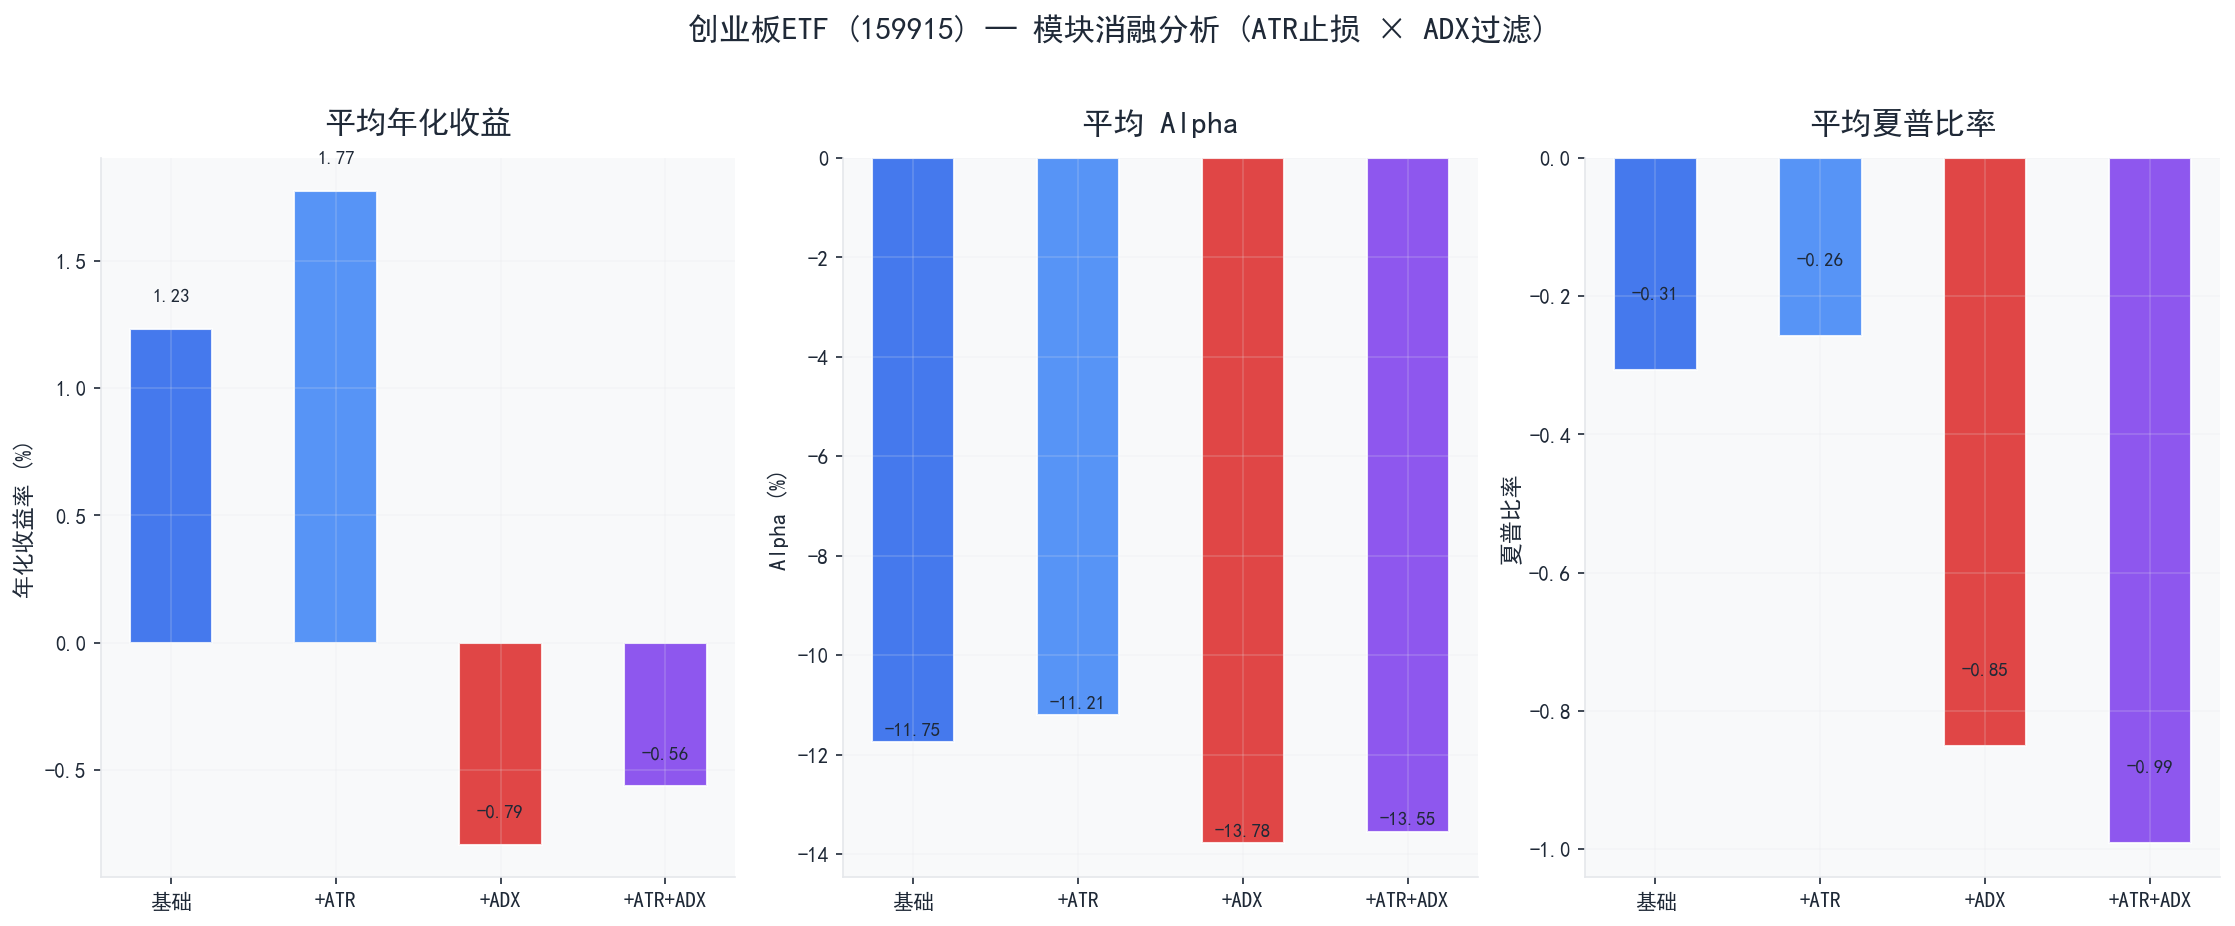
▲ 模块消融对比
| 模块组合 | 组合数 | 平均年化 | 平均Alpha | 平均夏普 | 平均回撤 | 正收益占比 |
|---|---|---|---|---|---|---|
| 基础策略 | 36288 | 1.23% | -11.75% | -0.306 | 35.04% | 55.9% |
| +ATR止损 | 145152 | 1.77% | -11.21% | -0.258 | 28.75% | 65.3% |
| +ADX过滤 | 108864 | -0.79% | -13.78% | -0.850 | 17.10% | 17.5% |
| +ATR+ADX | 435456 | -0.56% | -13.55% | -0.991 | 13.10% | 15.6% |
沪深300ETF (510300) 策略分析
全局统计
| 指标 | 数值 |
|---|---|
| 有效组合数 | 725760 |
| 正收益组合 | 517908 (71.4%) |
| 年化收益率范围 | -3.56% ~ 9.54% |
| 年化收益率中位数 | 0.55% |
| 年化收益率均值 | 0.92% |
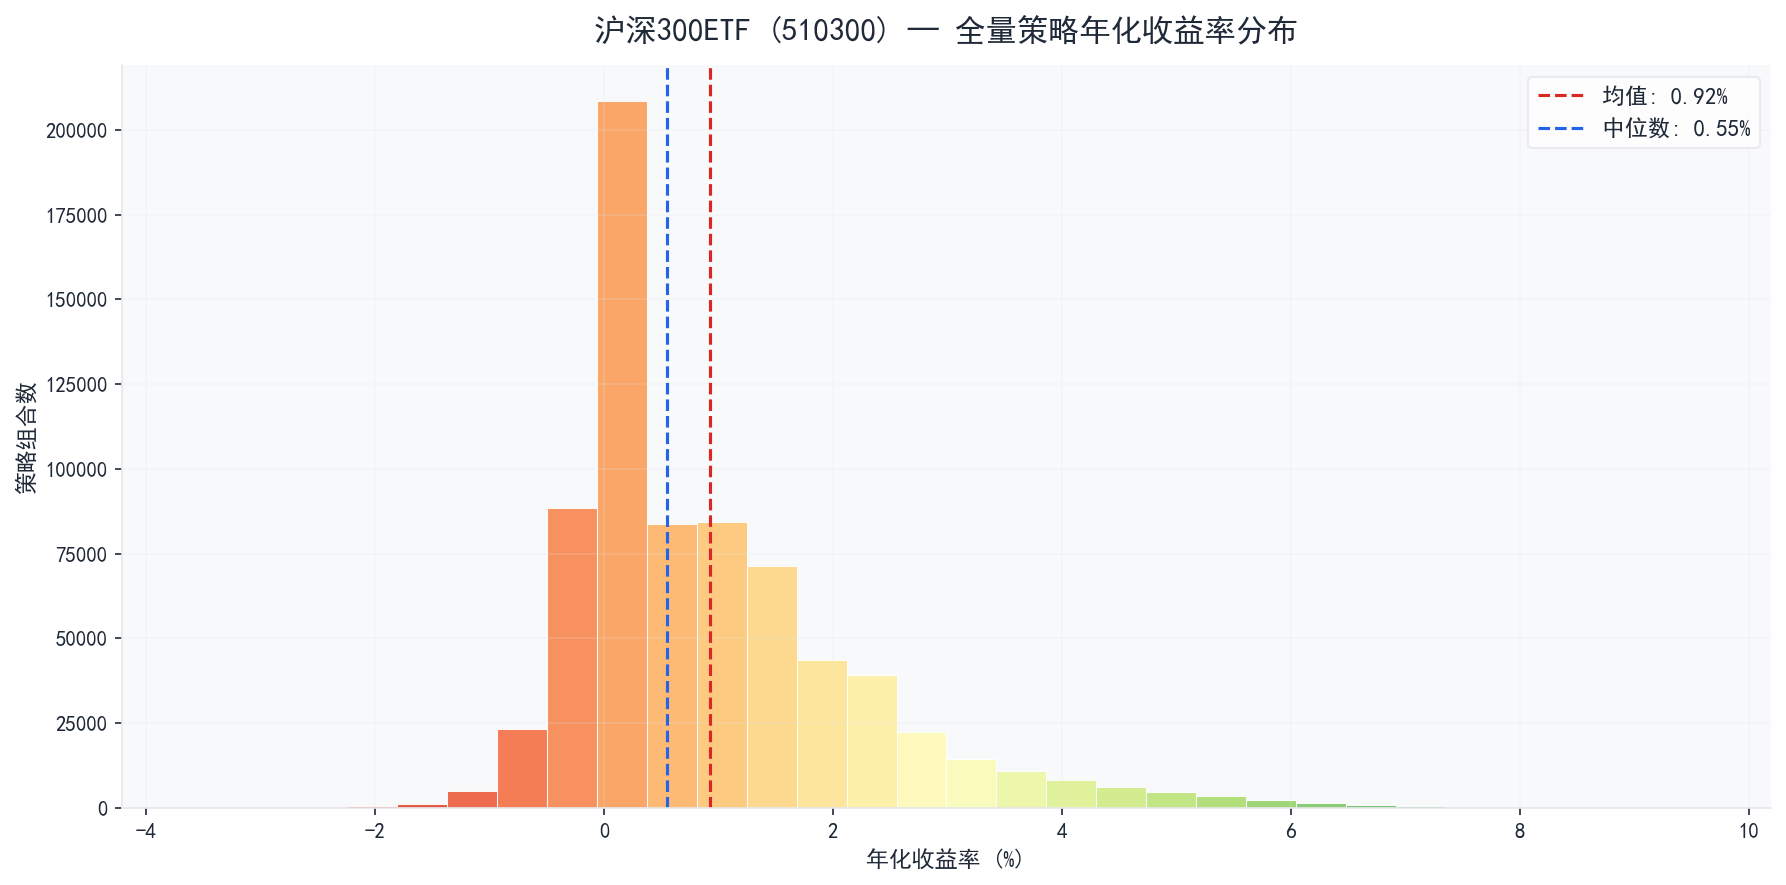
▲ 收益分布
Top 5 最优策略
表现最好的 5 组参数组合:
| 排名 | 年化收益 | Alpha | 基准年化 | 最大回撤 | 夏普比率 | 胜率 | 年均交易 | ATR | ADX | BIAS |
|---|---|---|---|---|---|---|---|---|---|---|
| 1 | 9.54% | +2.75% | 6.79% | 34.73% | 0.477 | 37.5% | 1.3 | ✓ | ✗ | ✗ |
| 2 | 9.54% | +2.75% | 6.79% | 34.73% | 0.477 | 37.5% | 1.3 | ✓ | ✗ | ✗ |
| 3 | 9.54% | +2.75% | 6.79% | 26.66% | 0.515 | 37.5% | 1.3 | ✓ | ✗ | ✗ |
| 4 | 9.52% | +2.73% | 6.79% | 34.73% | 0.480 | 37.5% | 1.3 | ✓ | ✗ | ✗ |
| 5 | 9.52% | +2.73% | 6.79% | 34.73% | 0.480 | 37.5% | 1.3 | ✓ | ✗ | ✗ |
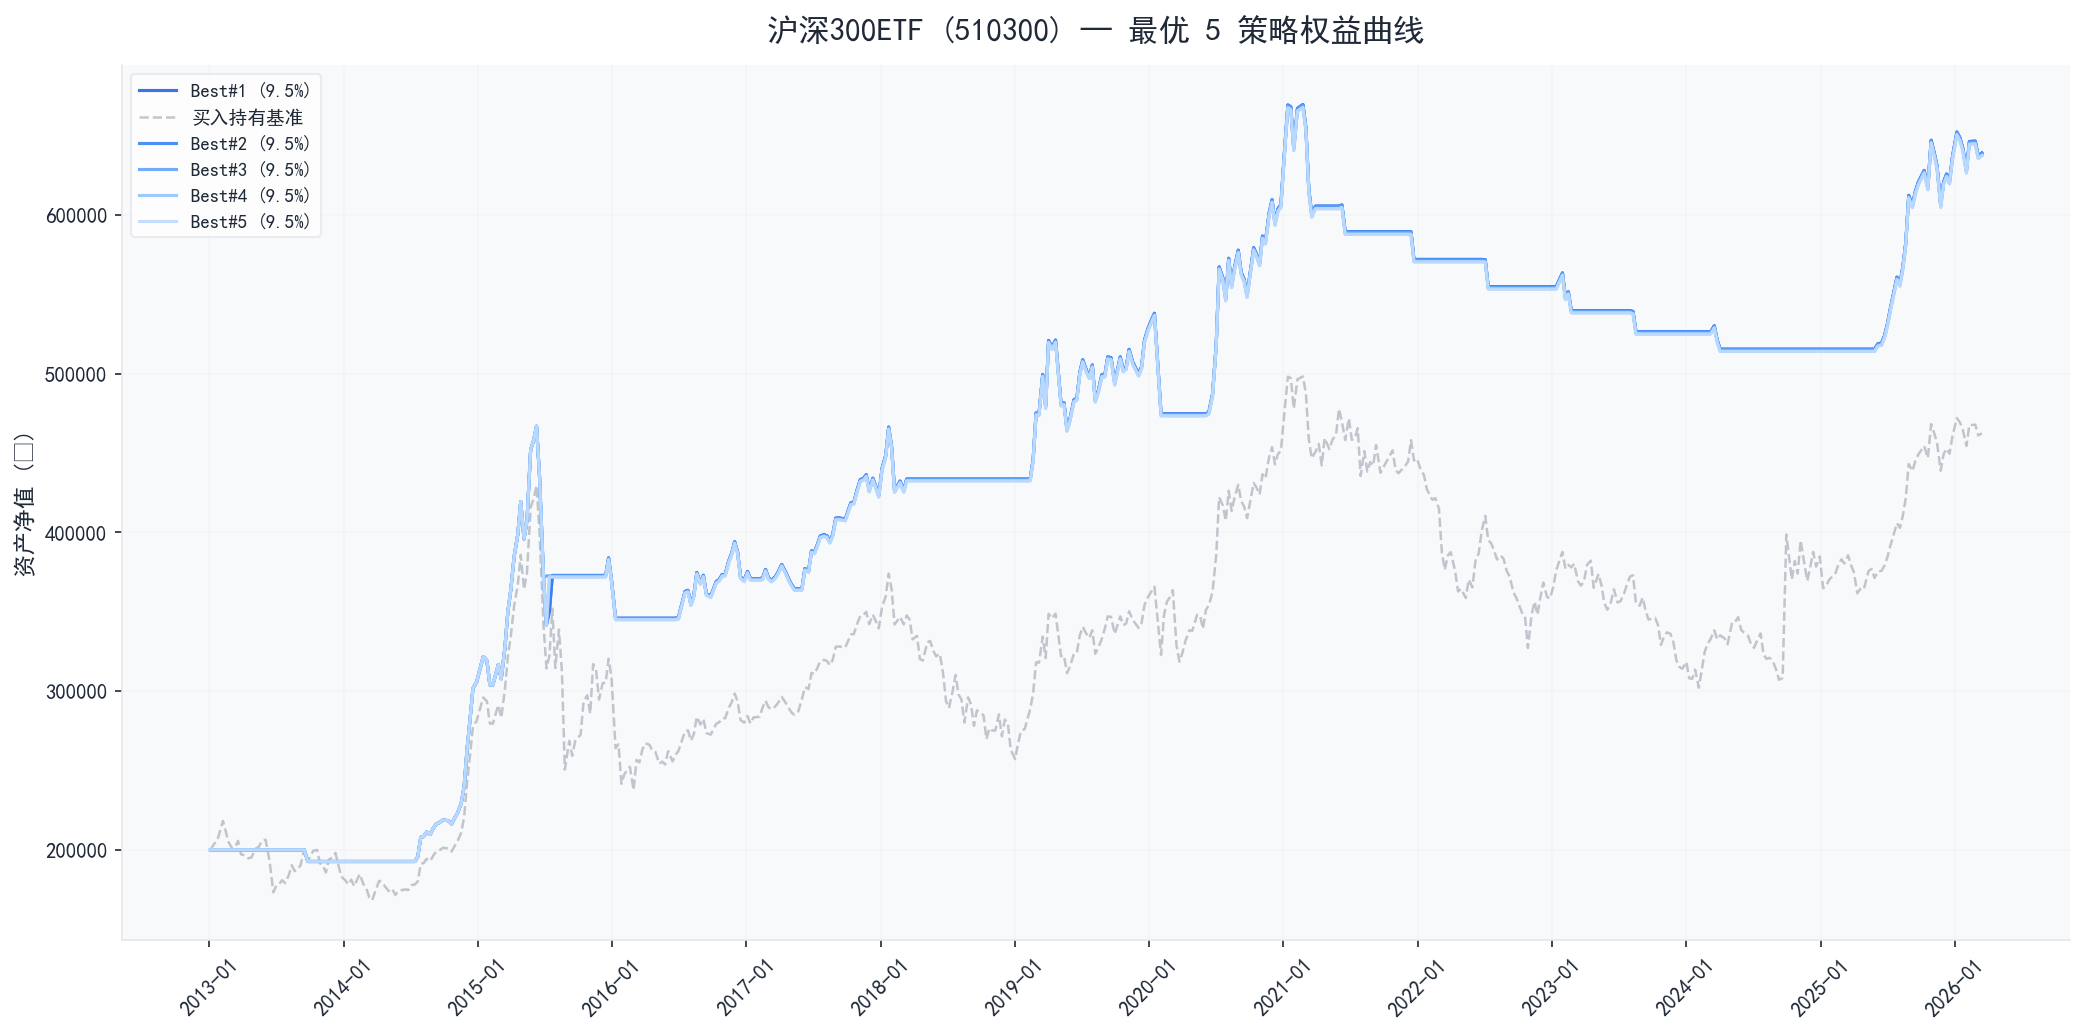
▲ 最优策略权益曲线
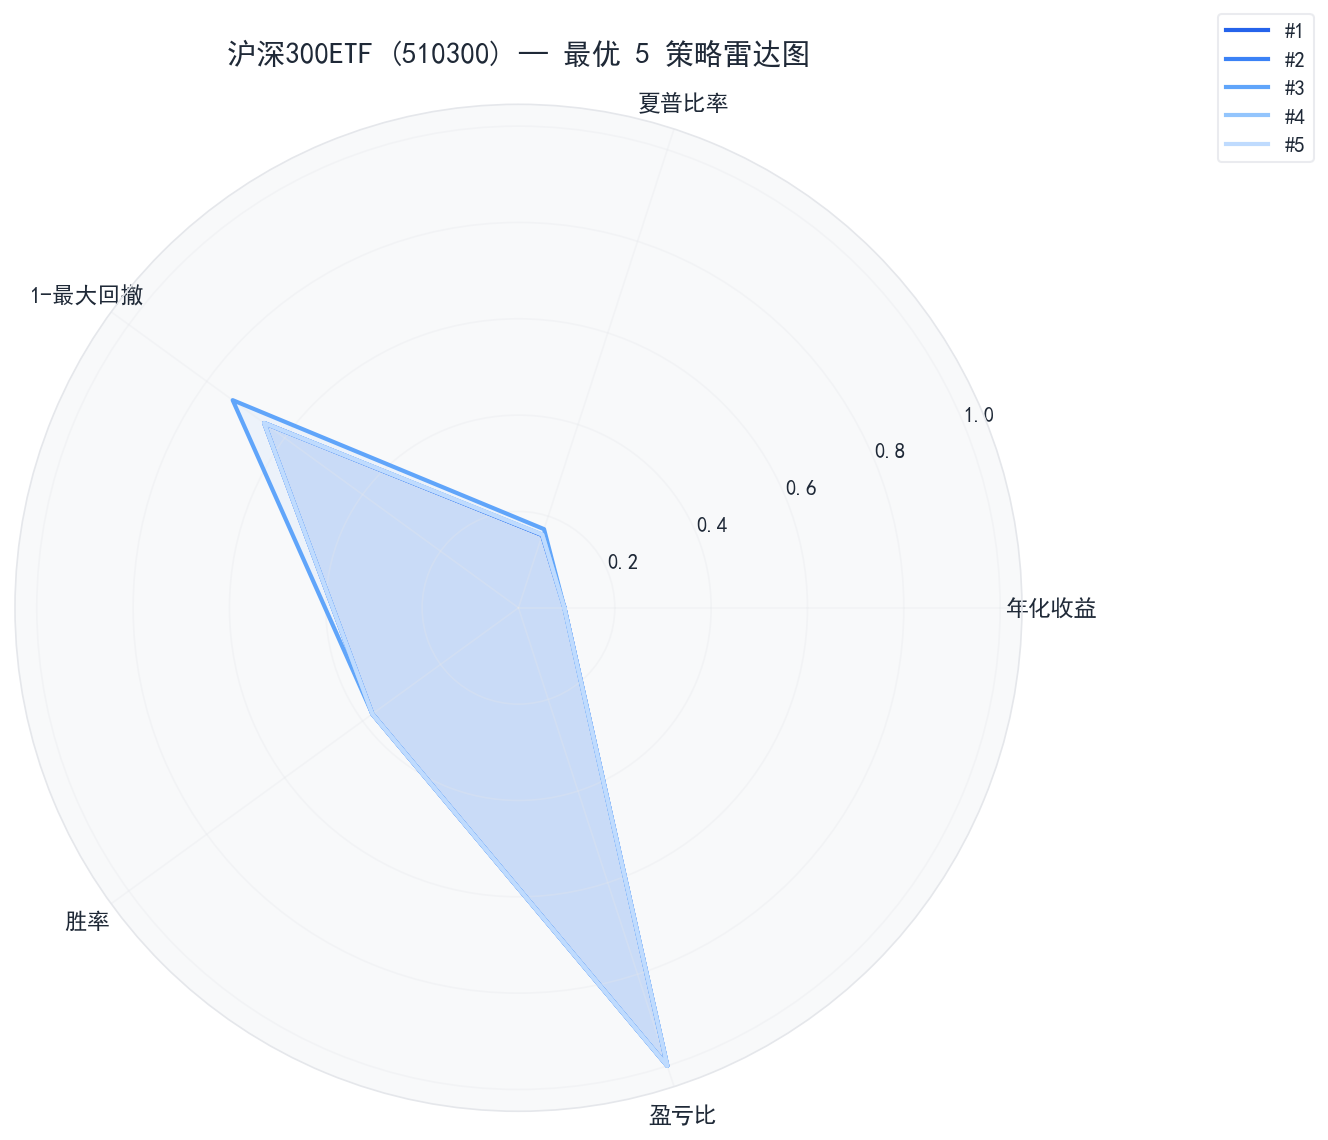
▲ 最优策略雷达图
Top 5 参数详情
- #1 — 年化 9.54% · 夏普 0.477 · 回撤 34.73%
{ "sma_long": 120, "rv_window": 20, "sma_short": 20, "bias_lower": -3.0, "bias_upper": 3.0, "enable_adx": false, "enable_atr": true, "start_year": 2013, "bias_window": 5, "bias_enabled": false, "rv_threshold": 2.5, "adx_threshold": 20, "position_base": 1.0, "position_mode": "fixed", "atr_stop_multiplier": 1.5}短期均线(20日)×半年线(120日);严格波动率过滤;BIAS关;ATR止损×1.5;ADX关;固定仓位(100%)
- #2 — 年化 9.54% · 夏普 0.477 · 回撤 34.73%
{ "sma_long": 120, "rv_window": 30, "sma_short": 20, "bias_lower": -3.0, "bias_upper": 3.0, "enable_adx": false, "enable_atr": true, "start_year": 2013, "bias_window": 5, "bias_enabled": false, "rv_threshold": 2.0, "adx_threshold": 20, "position_base": 1.0, "position_mode": "fixed", "atr_stop_multiplier": 1.5}短期均线(20日)×半年线(120日);较高波动率过滤;BIAS关;ATR止损×1.5;ADX关;固定仓位(100%)
- #3 — 年化 9.54% · 夏普 0.515 · 回撤 26.66%
{ "sma_long": 120, "rv_window": 10, "sma_short": 20, "bias_lower": -3.0, "bias_upper": 3.0, "enable_adx": false, "enable_atr": true, "start_year": 2013, "bias_window": 5, "bias_enabled": false, "rv_threshold": 2.0, "adx_threshold": 20, "position_base": 1.0, "position_mode": "fixed", "atr_stop_multiplier": 1.5}短期均线(20日)×半年线(120日);较高波动率过滤;BIAS关;ATR止损×1.5;ADX关;固定仓位(100%)
- #4 — 年化 9.52% · 夏普 0.480 · 回撤 34.73%
{ "sma_long": 120, "rv_window": 10, "sma_short": 20, "bias_lower": -3.0, "bias_upper": 3.0, "enable_adx": false, "enable_atr": true, "start_year": 2013, "bias_window": 5, "bias_enabled": false, "rv_threshold": 2.5, "adx_threshold": 20, "position_base": 1.0, "position_mode": "fixed", "atr_stop_multiplier": 1.5}短期均线(20日)×半年线(120日);严格波动率过滤;BIAS关;ATR止损×1.5;ADX关;固定仓位(100%)
- #5 — 年化 9.52% · 夏普 0.480 · 回撤 34.73%
{ "sma_long": 120, "rv_window": 20, "sma_short": 20, "bias_lower": -3.0, "bias_upper": 3.0, "enable_adx": false, "enable_atr": true, "start_year": 2013, "bias_window": 5, "bias_enabled": false, "rv_threshold": 2.0, "adx_threshold": 20, "position_base": 1.0, "position_mode": "fixed", "atr_stop_multiplier": 1.5}短期均线(20日)×半年线(120日);较高波动率过滤;BIAS关;ATR止损×1.5;ADX关;固定仓位(100%)
Bottom 5 最差策略
表现最差的 5 组参数组合:
| 排名 | 年化收益 | Alpha | 基准年化 | 最大回撤 | 夏普比率 | 胜率 | 年均交易 | ATR | ADX | BIAS |
|---|---|---|---|---|---|---|---|---|---|---|
| 1 | -3.56% | -10.34% | 6.79% | 44.05% | -0.589 | 21.9% | 2.5 | ✓ | ✗ | ✗ |
| 2 | -3.56% | -10.34% | 6.79% | 44.05% | -0.589 | 21.9% | 2.5 | ✓ | ✗ | ✗ |
| 3 | -3.56% | -10.34% | 6.79% | 44.05% | -0.589 | 21.9% | 2.5 | ✓ | ✗ | ✗ |
| 4 | -3.56% | -10.34% | 6.79% | 44.05% | -0.589 | 21.9% | 2.5 | ✓ | ✗ | ✗ |
| 5 | -2.85% | -9.63% | 6.79% | 38.59% | -0.536 | 22.6% | 2.4 | ✓ | ✗ | ✓ |
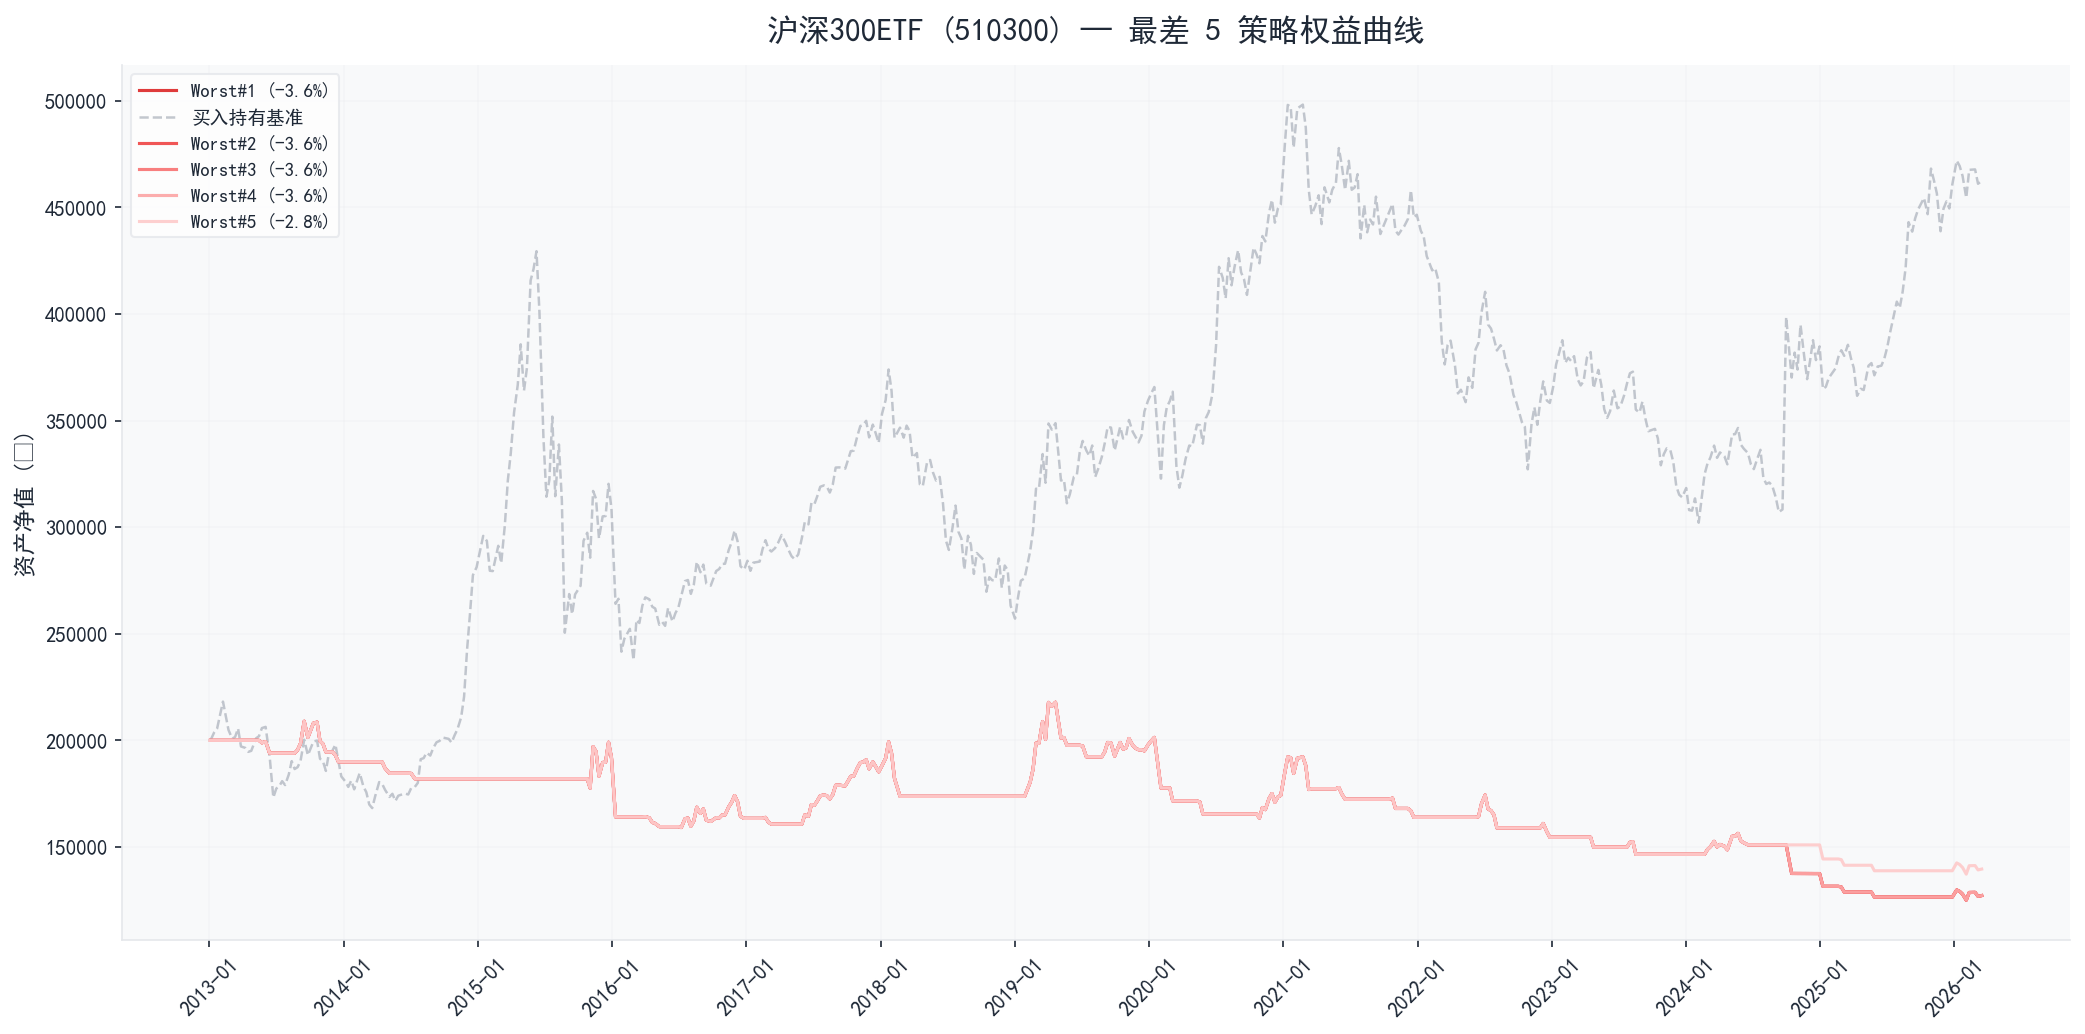
▲ 最差策略权益曲线
Bottom 5 参数详情
- #1 — 年化 -3.56% · 夏普 -0.589 · 回撤 44.05%
{ "sma_long": 60, "rv_window": 30, "sma_short": 15, "bias_lower": -3.0, "bias_upper": 3.0, "enable_adx": false, "enable_atr": true, "start_year": 2013, "bias_window": 5, "bias_enabled": false, "rv_threshold": 2.5, "adx_threshold": 20, "position_base": 1.0, "position_mode": "fixed", "atr_stop_multiplier": 1.5}中短期均线(15日)×季线级别(60日);严格波动率过滤;BIAS关;ATR止损×1.5;ADX关;固定仓位(100%)
- #2 — 年化 -3.56% · 夏普 -0.589 · 回撤 44.05%
{ "sma_long": 60, "rv_window": 30, "sma_short": 15, "bias_lower": -3.0, "bias_upper": 3.0, "enable_adx": false, "enable_atr": true, "start_year": 2013, "bias_window": 5, "bias_enabled": false, "rv_threshold": 2.0, "adx_threshold": 20, "position_base": 1.0, "position_mode": "fixed", "atr_stop_multiplier": 1.5}中短期均线(15日)×季线级别(60日);较高波动率过滤;BIAS关;ATR止损×1.5;ADX关;固定仓位(100%)
- #3 — 年化 -3.56% · 夏普 -0.589 · 回撤 44.05%
{ "sma_long": 60, "rv_window": 20, "sma_short": 15, "bias_lower": -3.0, "bias_upper": 3.0, "enable_adx": false, "enable_atr": true, "start_year": 2013, "bias_window": 5, "bias_enabled": false, "rv_threshold": 2.5, "adx_threshold": 20, "position_base": 1.0, "position_mode": "fixed", "atr_stop_multiplier": 1.5}中短期均线(15日)×季线级别(60日);严格波动率过滤;BIAS关;ATR止损×1.5;ADX关;固定仓位(100%)
- #4 — 年化 -3.56% · 夏普 -0.589 · 回撤 44.05%
{ "sma_long": 60, "rv_window": 10, "sma_short": 15, "bias_lower": -3.0, "bias_upper": 3.0, "enable_adx": false, "enable_atr": true, "start_year": 2013, "bias_window": 5, "bias_enabled": false, "rv_threshold": 2.5, "adx_threshold": 20, "position_base": 1.0, "position_mode": "fixed", "atr_stop_multiplier": 1.5}中短期均线(15日)×季线级别(60日);严格波动率过滤;BIAS关;ATR止损×1.5;ADX关;固定仓位(100%)
- #5 — 年化 -2.85% · 夏普 -0.536 · 回撤 38.59%
{ "sma_long": 60, "rv_window": 30, "sma_short": 15, "bias_lower": -8.0, "bias_upper": 8.0, "enable_adx": false, "enable_atr": true, "start_year": 2013, "bias_window": 5, "bias_enabled": true, "rv_threshold": 2.5, "adx_threshold": 20, "position_base": 1.0, "position_mode": "fixed", "atr_stop_multiplier": 1.5}中短期均线(15日)×季线级别(60日);严格波动率过滤;BIAS[-8.0%,8.0%];ATR止损×1.5;ADX关;固定仓位(100%)
Best vs Worst 对比分析
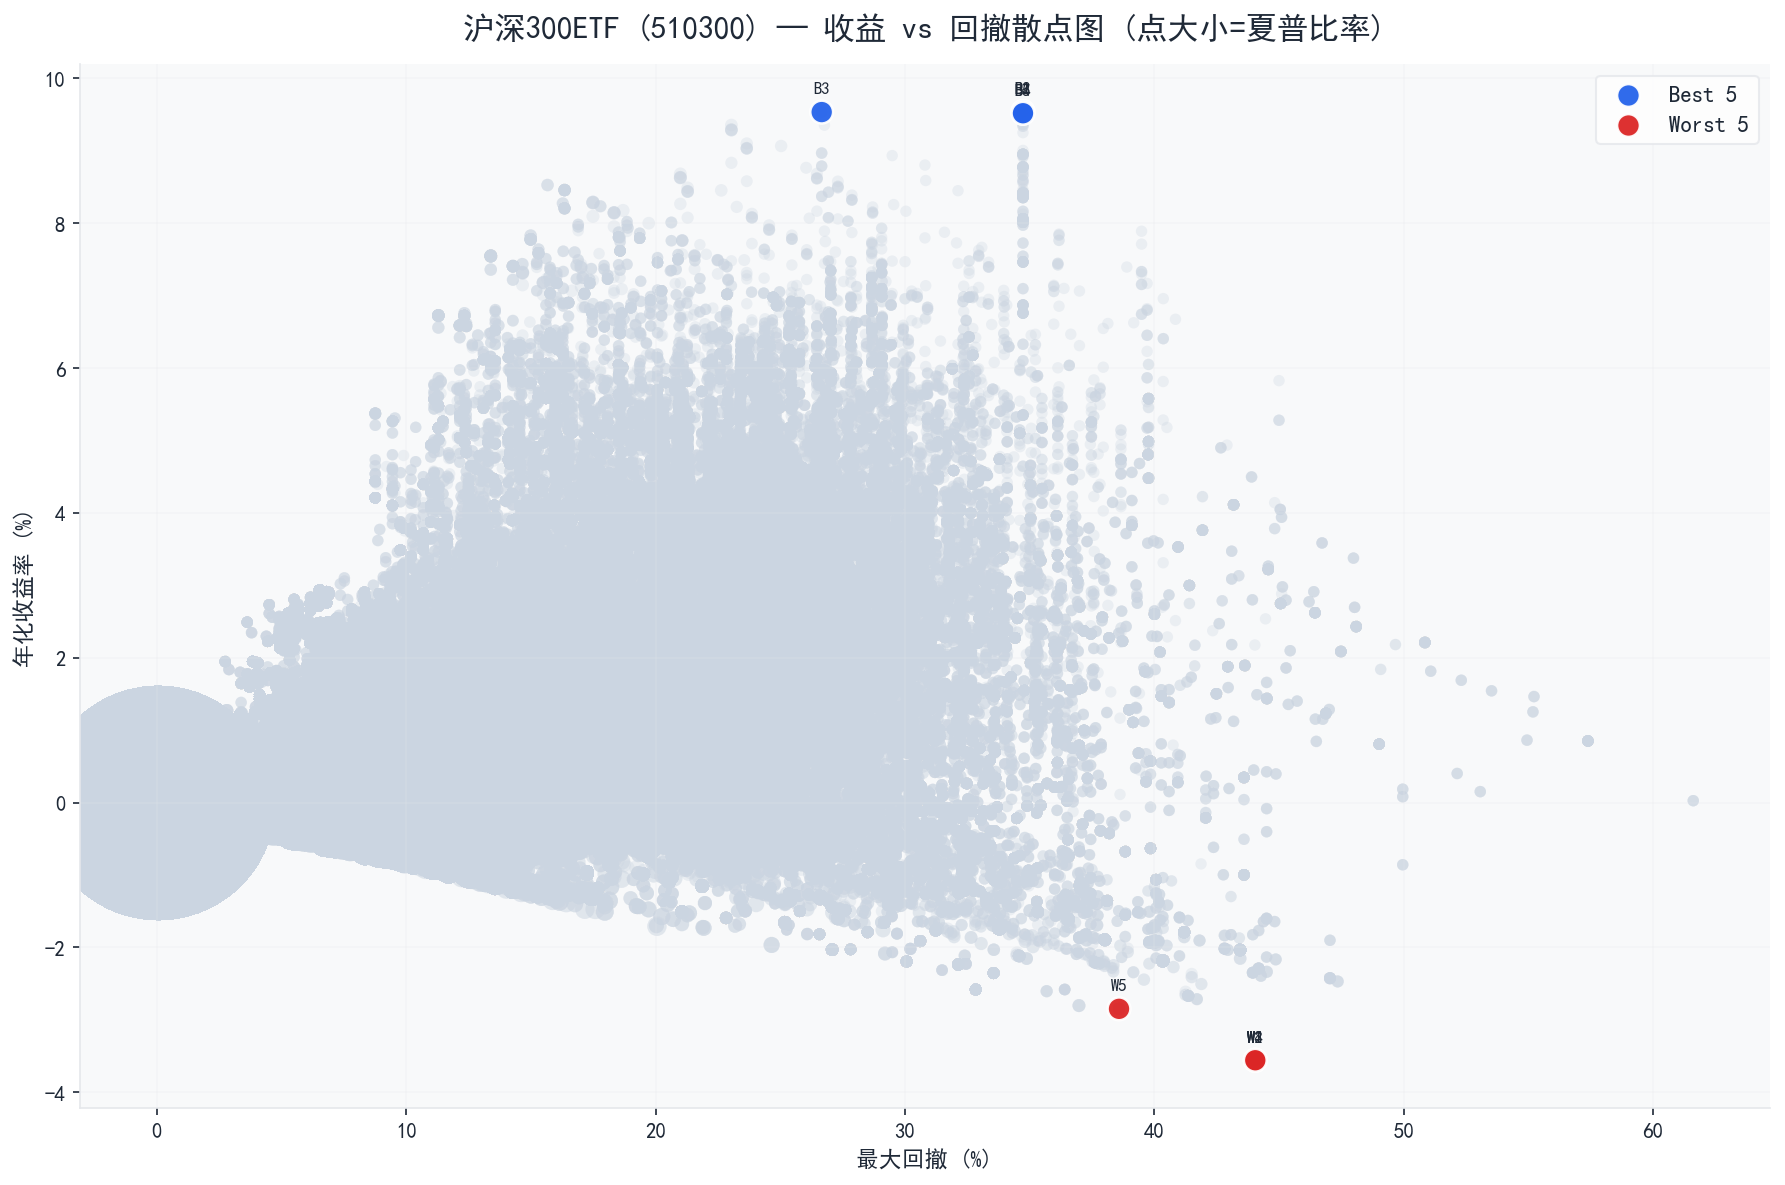
▲ 收益-回撤散点图
| 指标 | Best 5 均值 | Worst 5 均值 | 差异 |
|---|---|---|---|
| 年化收益率 | 9.53% | -3.42% | +12.95% |
| 夏普比率 | 0.486 | -0.579 | +1.064 |
| 最大回撤 | 33.12% | 42.96% | -9.84% |
| 胜率 | 37.5% | 22.0% | +15.5% |
因子敏感度分析
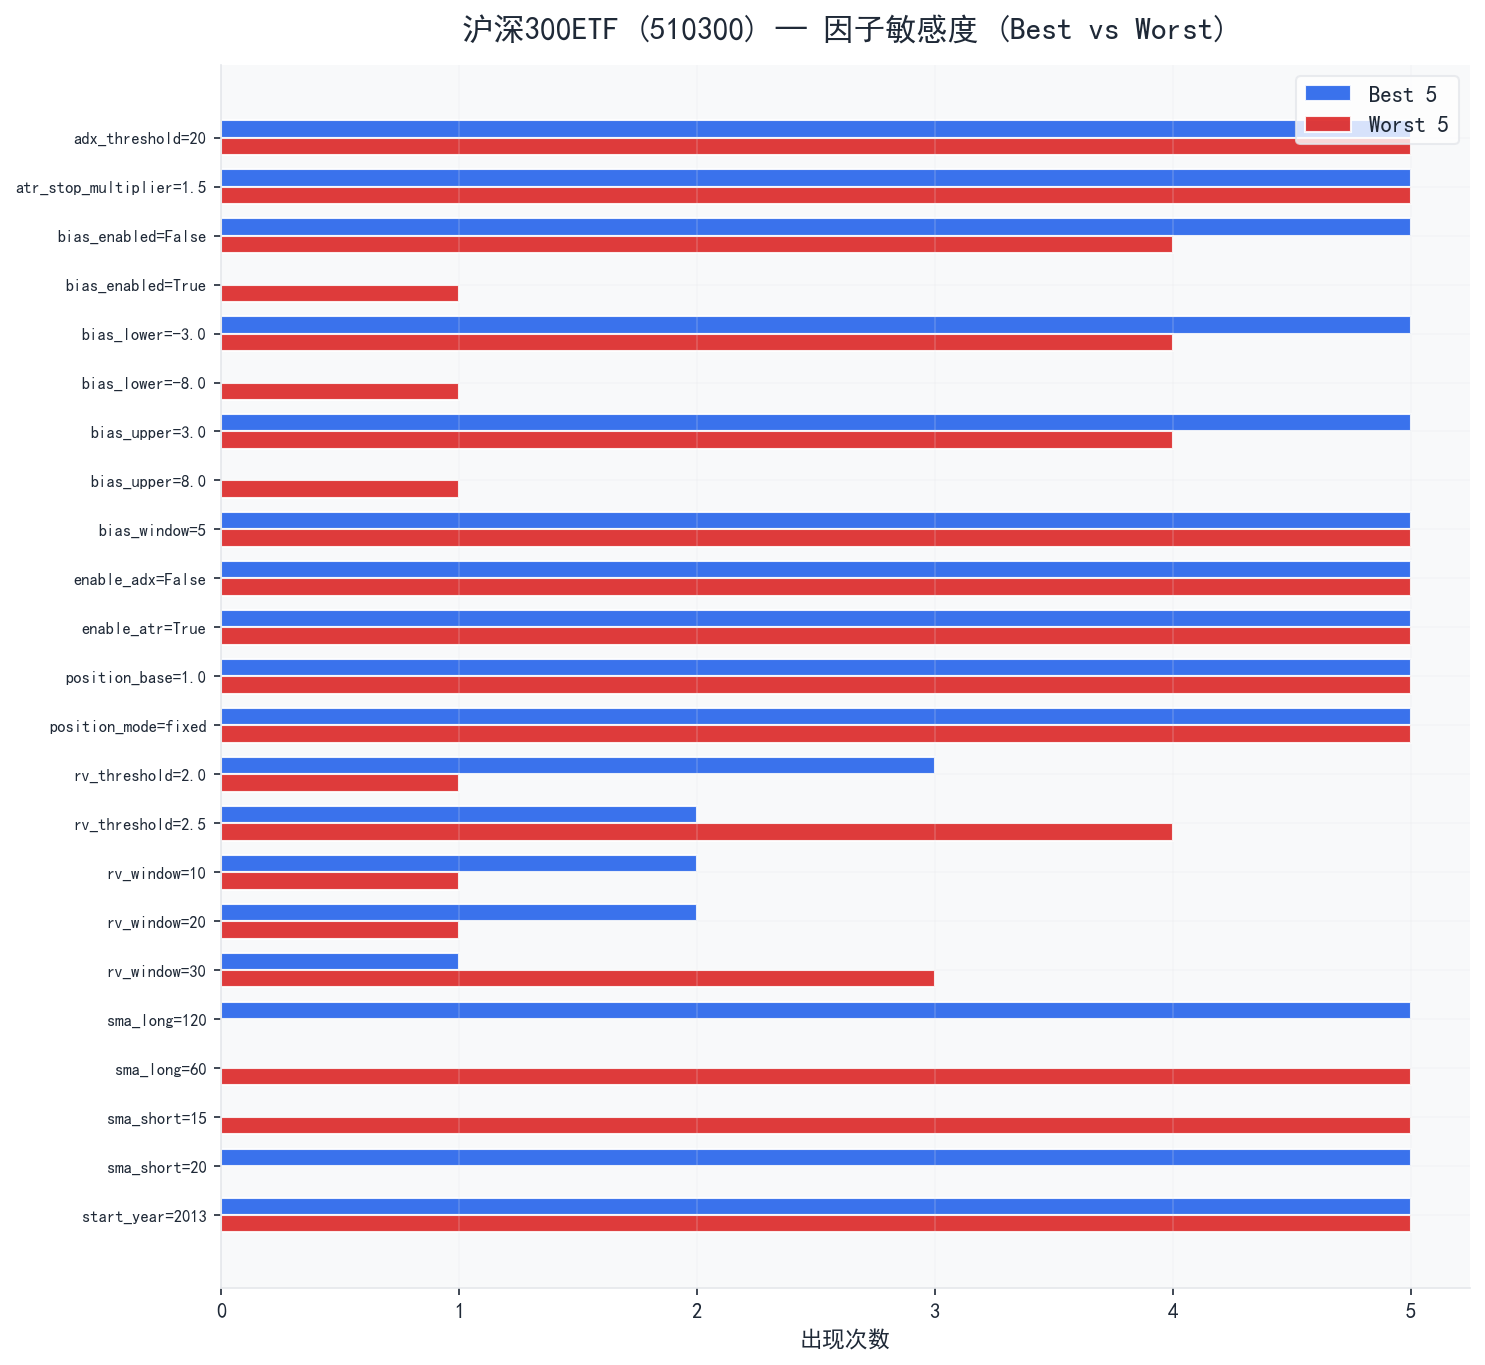
▲ 因子敏感度 最优与最差策略的因子差异:
rv_threshold: 最优策略偏好2.0,最差策略偏好2.5rv_window: 最优策略偏好20,最差策略偏好30sma_long: 最优策略偏好120,最差策略偏好60sma_short: 最优策略偏好20,最差策略偏好15
最优策略交易信号
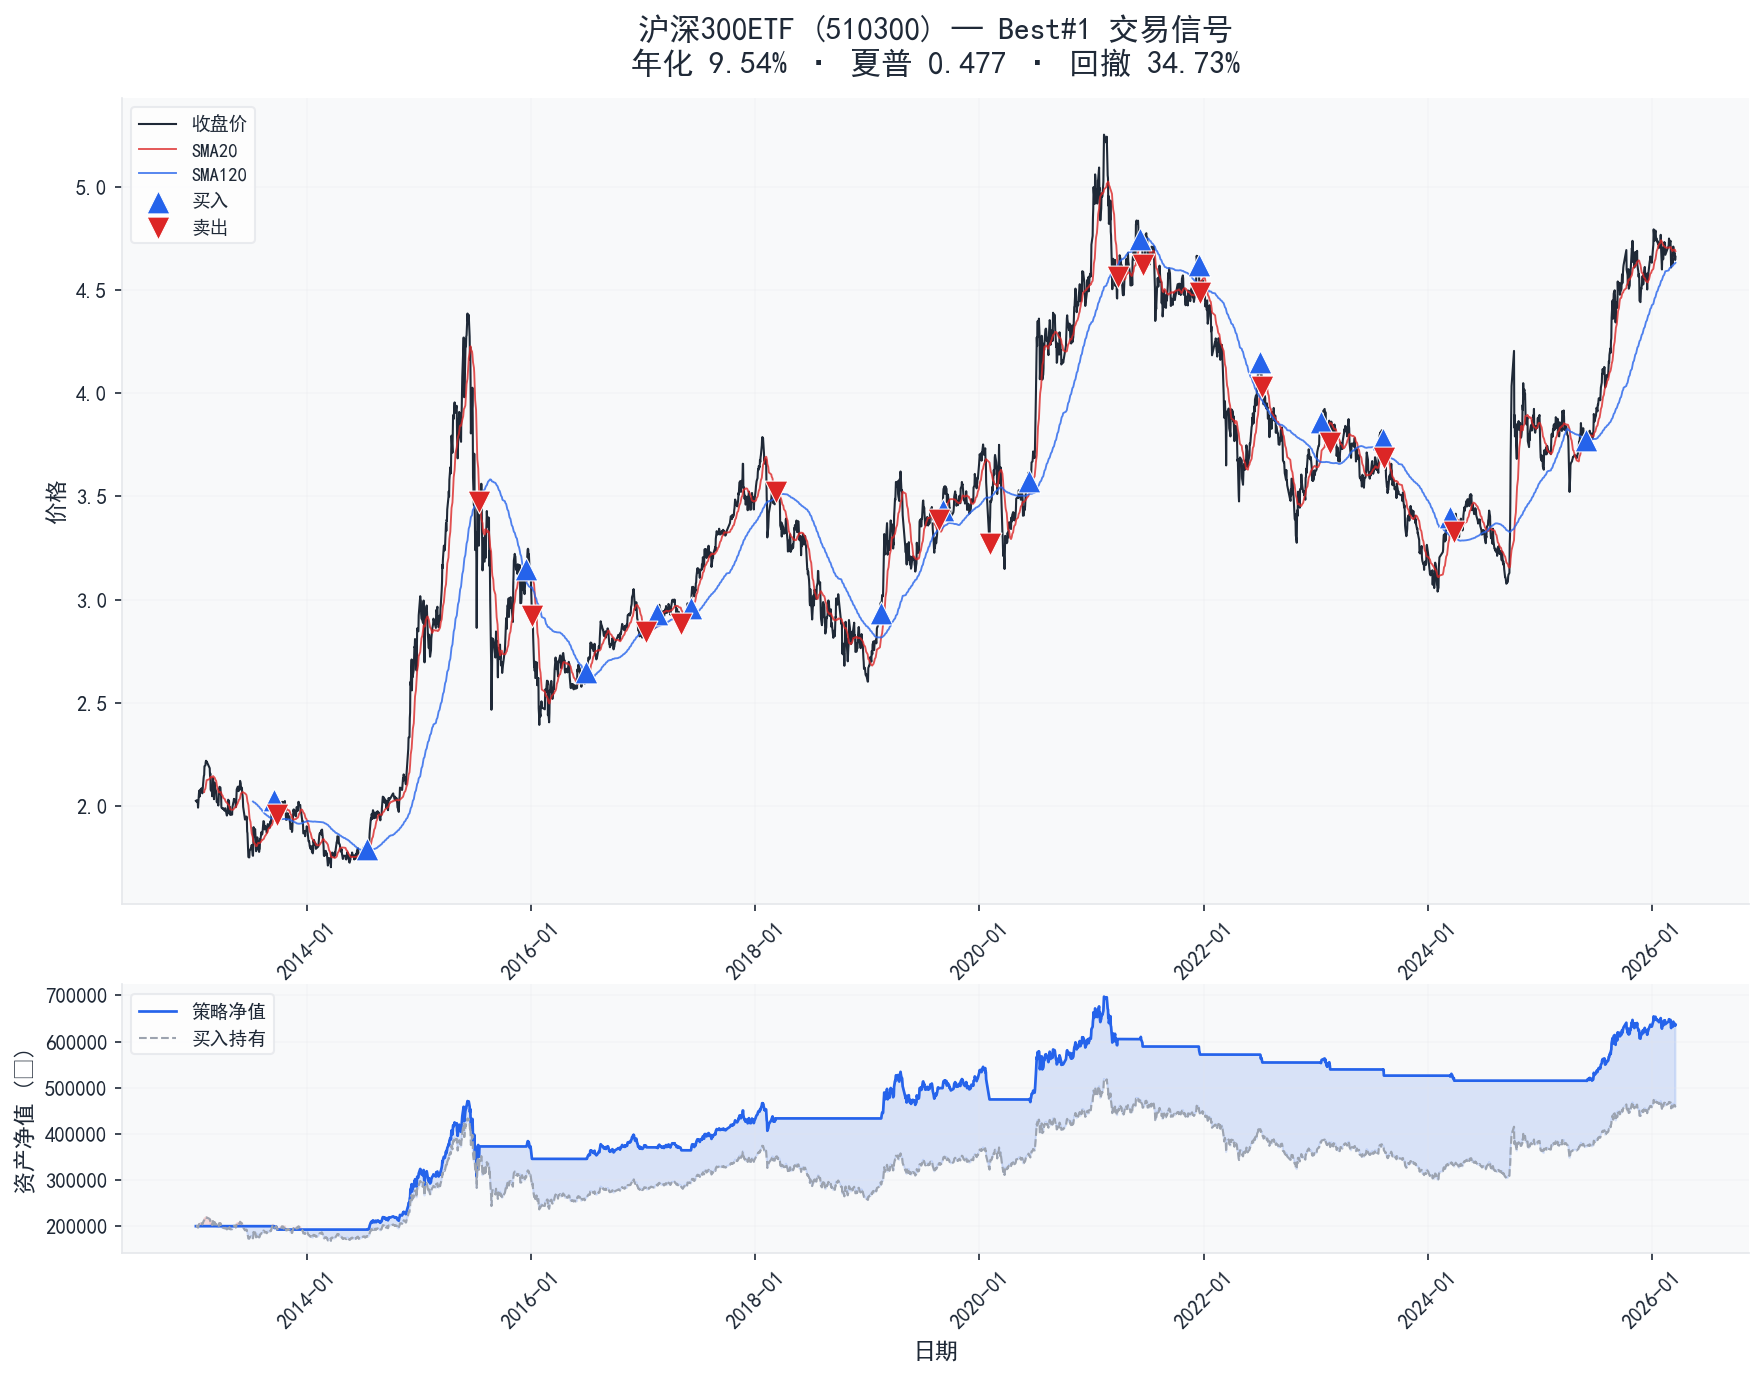
▲ 交易信号K线图
乖离率 vs 无乖离率 对比分析
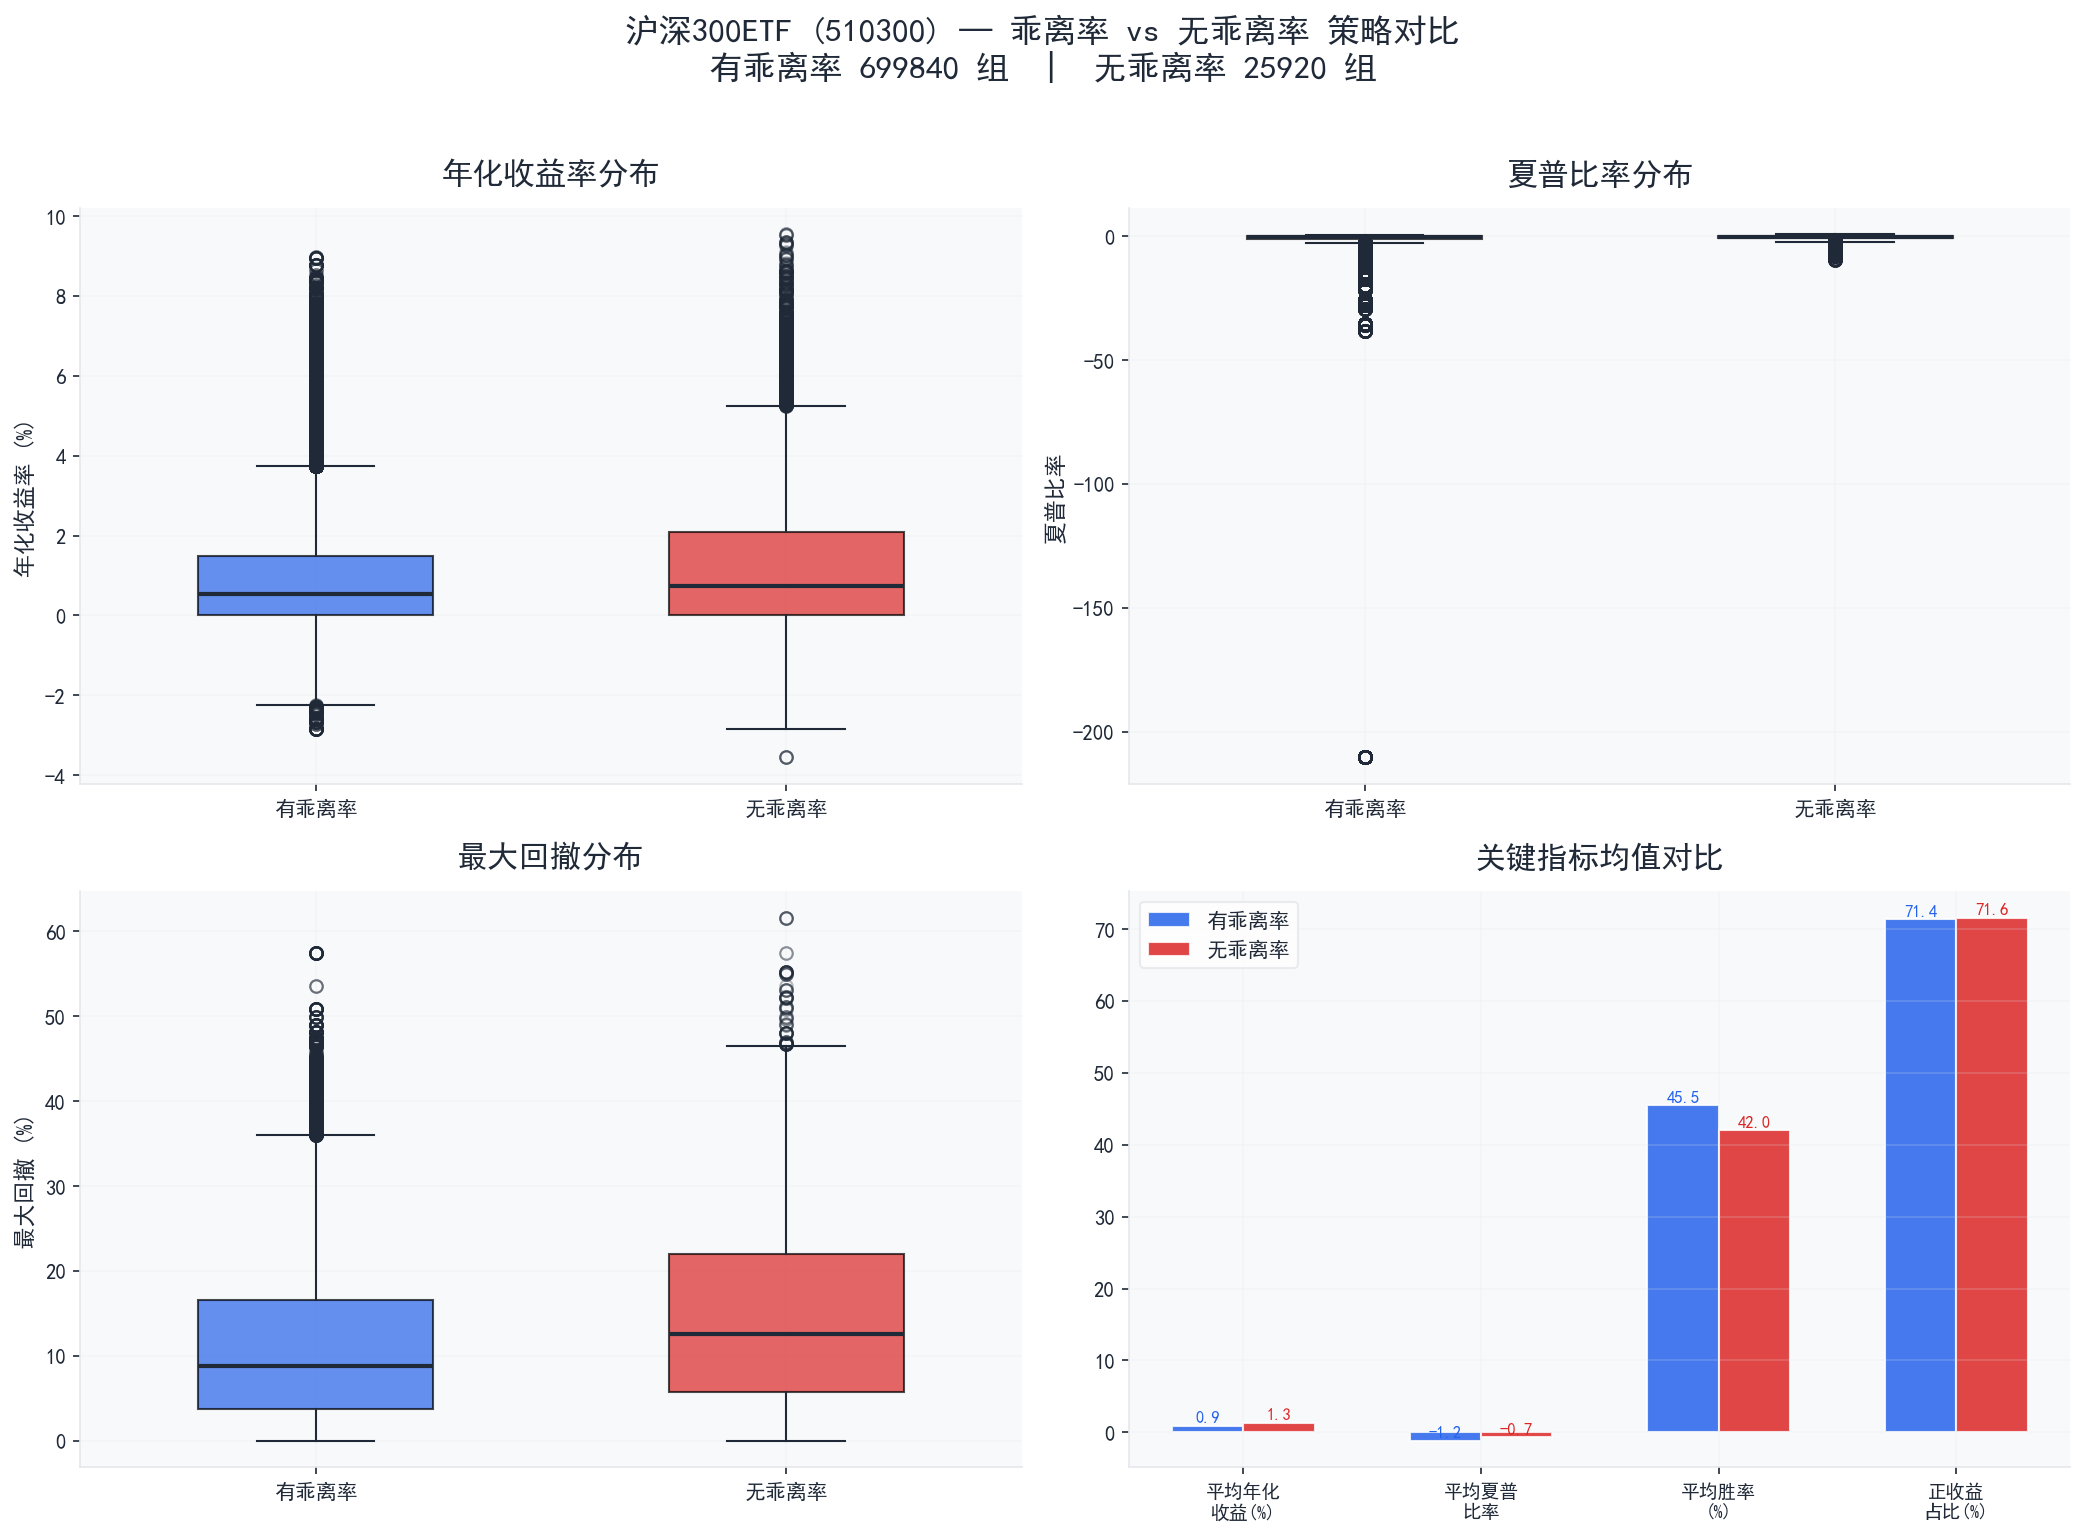
▲ 乖离率对比
| 指标 | 有乖离率 | 无乖离率 | 差异 |
|---|---|---|---|
| 组合数 | 699840 | 25920 | — |
| 平均年化收益 | 0.91% | 1.30% | -0.39% |
| 中位数年化收益 | 0.54% | 0.74% | -0.20% |
| 最高年化收益 | 8.97% | 9.54% | -0.57% |
| 平均夏普比率 | -1.152 | -0.654 | -0.498 |
| 平均最大回撤 | 10.69% | 14.51% | -3.82% |
| 平均胜率 | 45.5% | 42.0% | +3.5% |
| 正收益占比 | 71.4% | 71.6% | -0.2% |
| 平均交易次数 | 12.6 | 13.8 | -1.2 |
分析结论:
- 两组平均年化收益差异不大,乖离率对收益的影响有限
- 有乖离率组平均回撤低 3.82%,乖离率在风控方面发挥了积极作用
- 无乖离率组风险调整后收益更优,夏普比率高出 0.498
模块消融分析 (ATR止损 × ADX过滤)
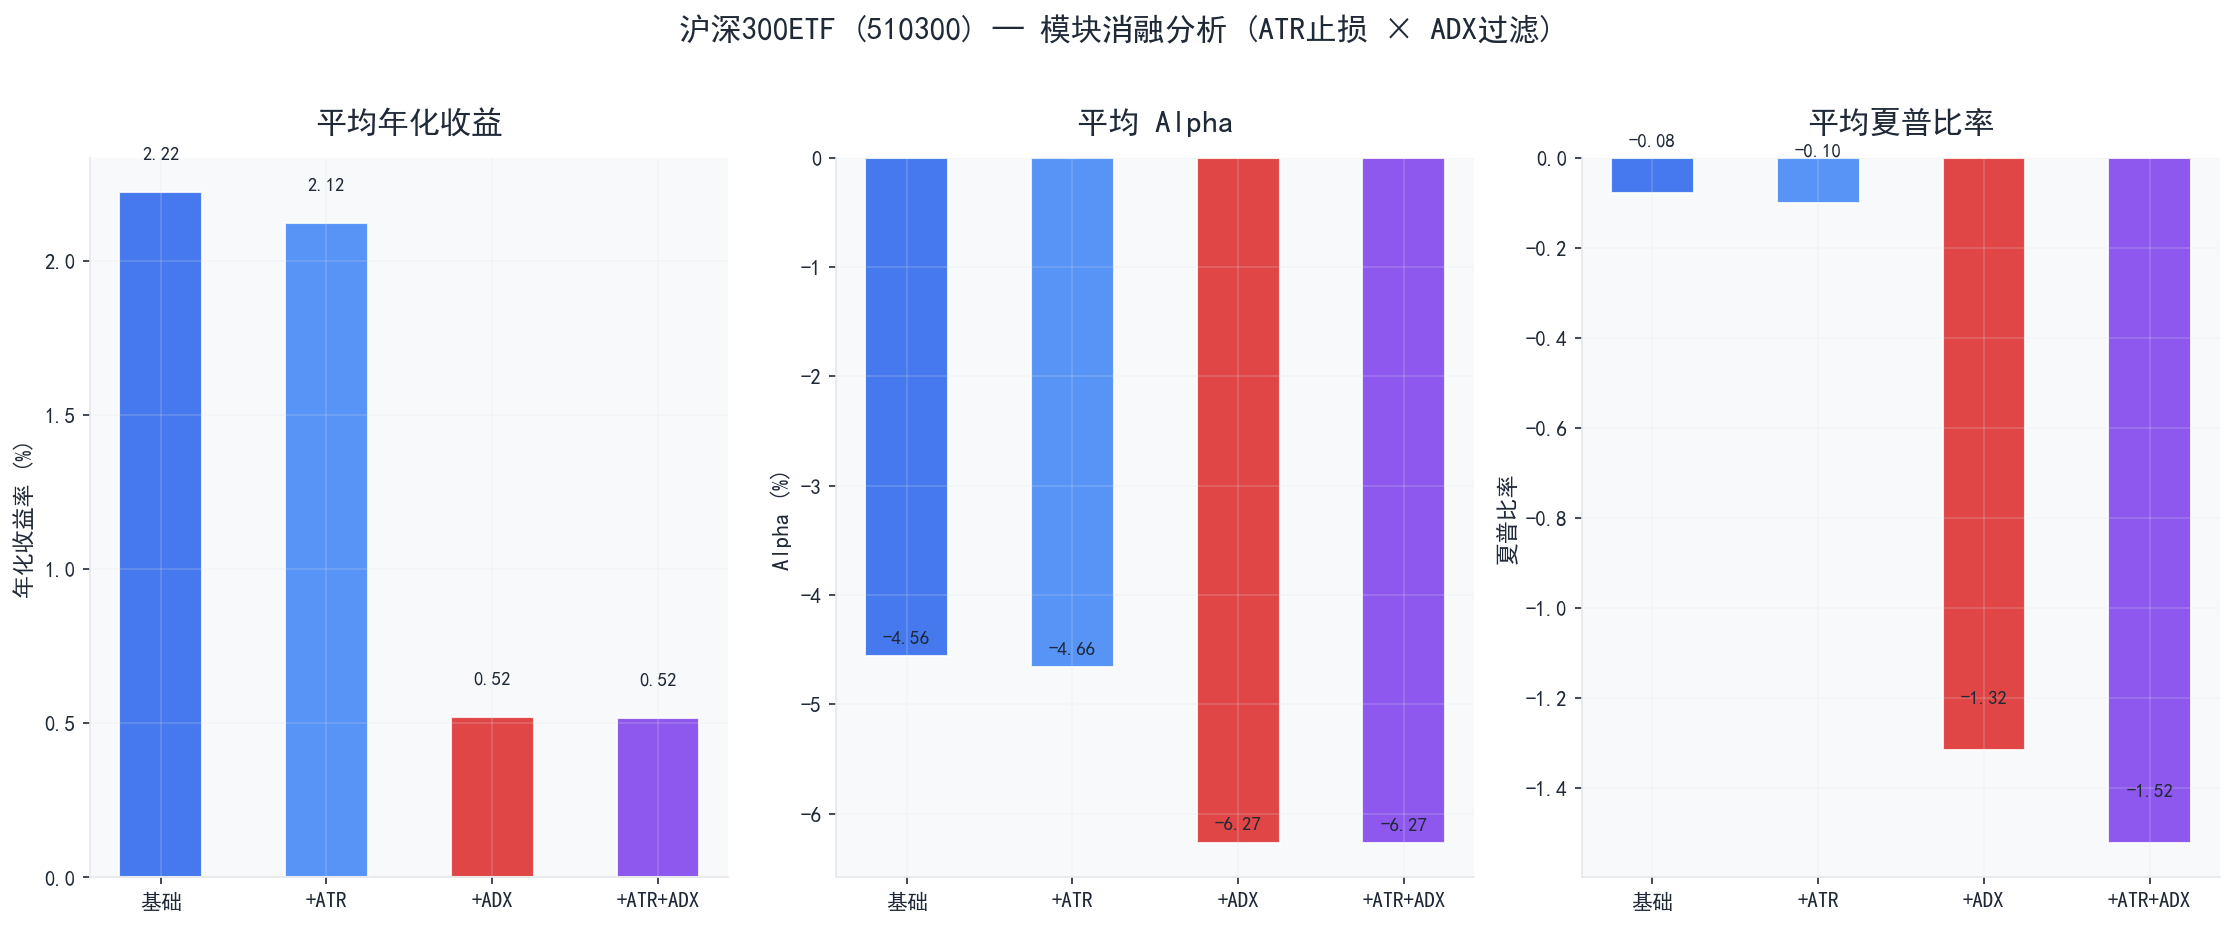
▲ 模块消融对比
| 模块组合 | 组合数 | 平均年化 | 平均Alpha | 平均夏普 | 平均回撤 | 正收益占比 |
|---|---|---|---|---|---|---|
| 基础策略 | 36288 | 2.22% | -4.56% | -0.079 | 21.97% | 94.3% |
| +ATR止损 | 145152 | 2.12% | -4.66% | -0.100 | 21.06% | 90.8% |
| +ADX过滤 | 108864 | 0.52% | -6.27% | -1.315 | 8.13% | 65.9% |
| +ATR+ADX | 435456 | 0.52% | -6.27% | -1.522 | 7.17% | 64.4% |
中证500ETF (510500) 策略分析
全局统计
| 指标 | 数值 |
|---|---|
| 有效组合数 | 725760 |
| 正收益组合 | 252867 (34.8%) |
| 年化收益率范围 | -5.50% ~ 12.56% |
| 年化收益率中位数 | 0.00% |
| 年化收益率均值 | 0.37% |
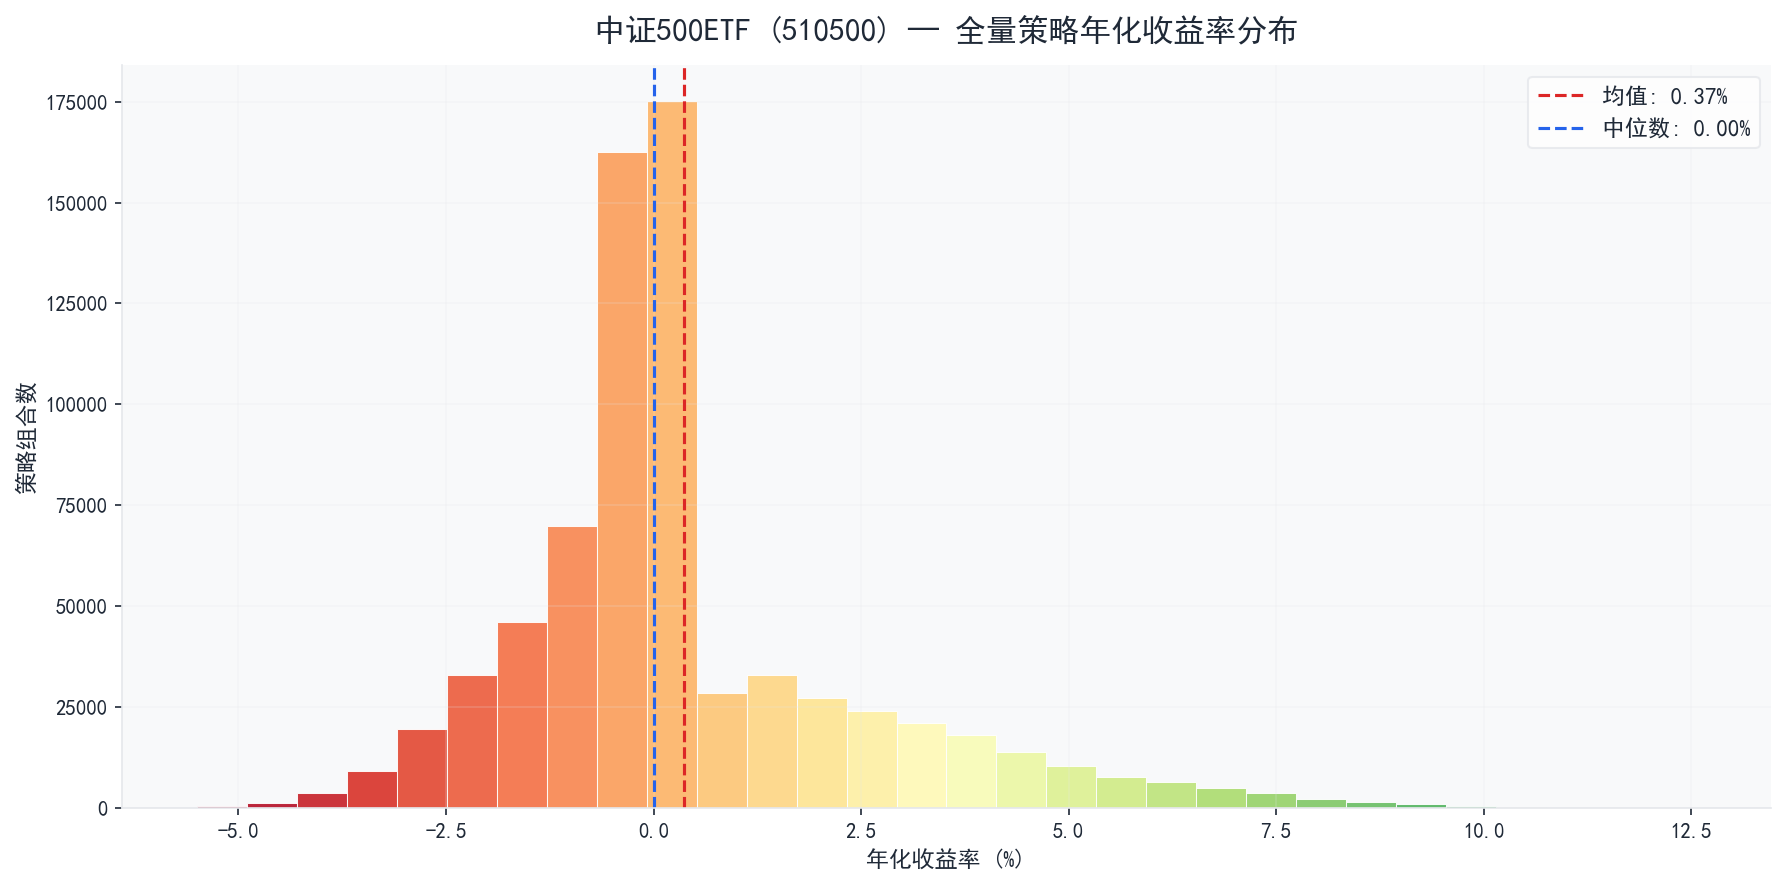
▲ 收益分布
Top 5 最优策略
表现最好的 5 组参数组合:
| 排名 | 年化收益 | Alpha | 基准年化 | 最大回撤 | 夏普比率 | 胜率 | 年均交易 | ATR | ADX | BIAS |
|---|---|---|---|---|---|---|---|---|---|---|
| 1 | 12.56% | +5.42% | 7.13% | 36.17% | 0.584 | 45.1% | 4.1 | ✗ | ✗ | ✗ |
| 2 | 12.29% | +5.15% | 7.13% | 36.17% | 0.575 | 46.2% | 4.1 | ✗ | ✗ | ✓ |
| 3 | 12.29% | +5.15% | 7.13% | 36.17% | 0.575 | 46.2% | 4.1 | ✗ | ✗ | ✓ |
| 4 | 12.29% | +5.15% | 7.13% | 36.17% | 0.575 | 46.2% | 4.1 | ✗ | ✗ | ✓ |
| 5 | 12.29% | +5.15% | 7.13% | 36.17% | 0.575 | 46.2% | 4.1 | ✗ | ✗ | ✓ |
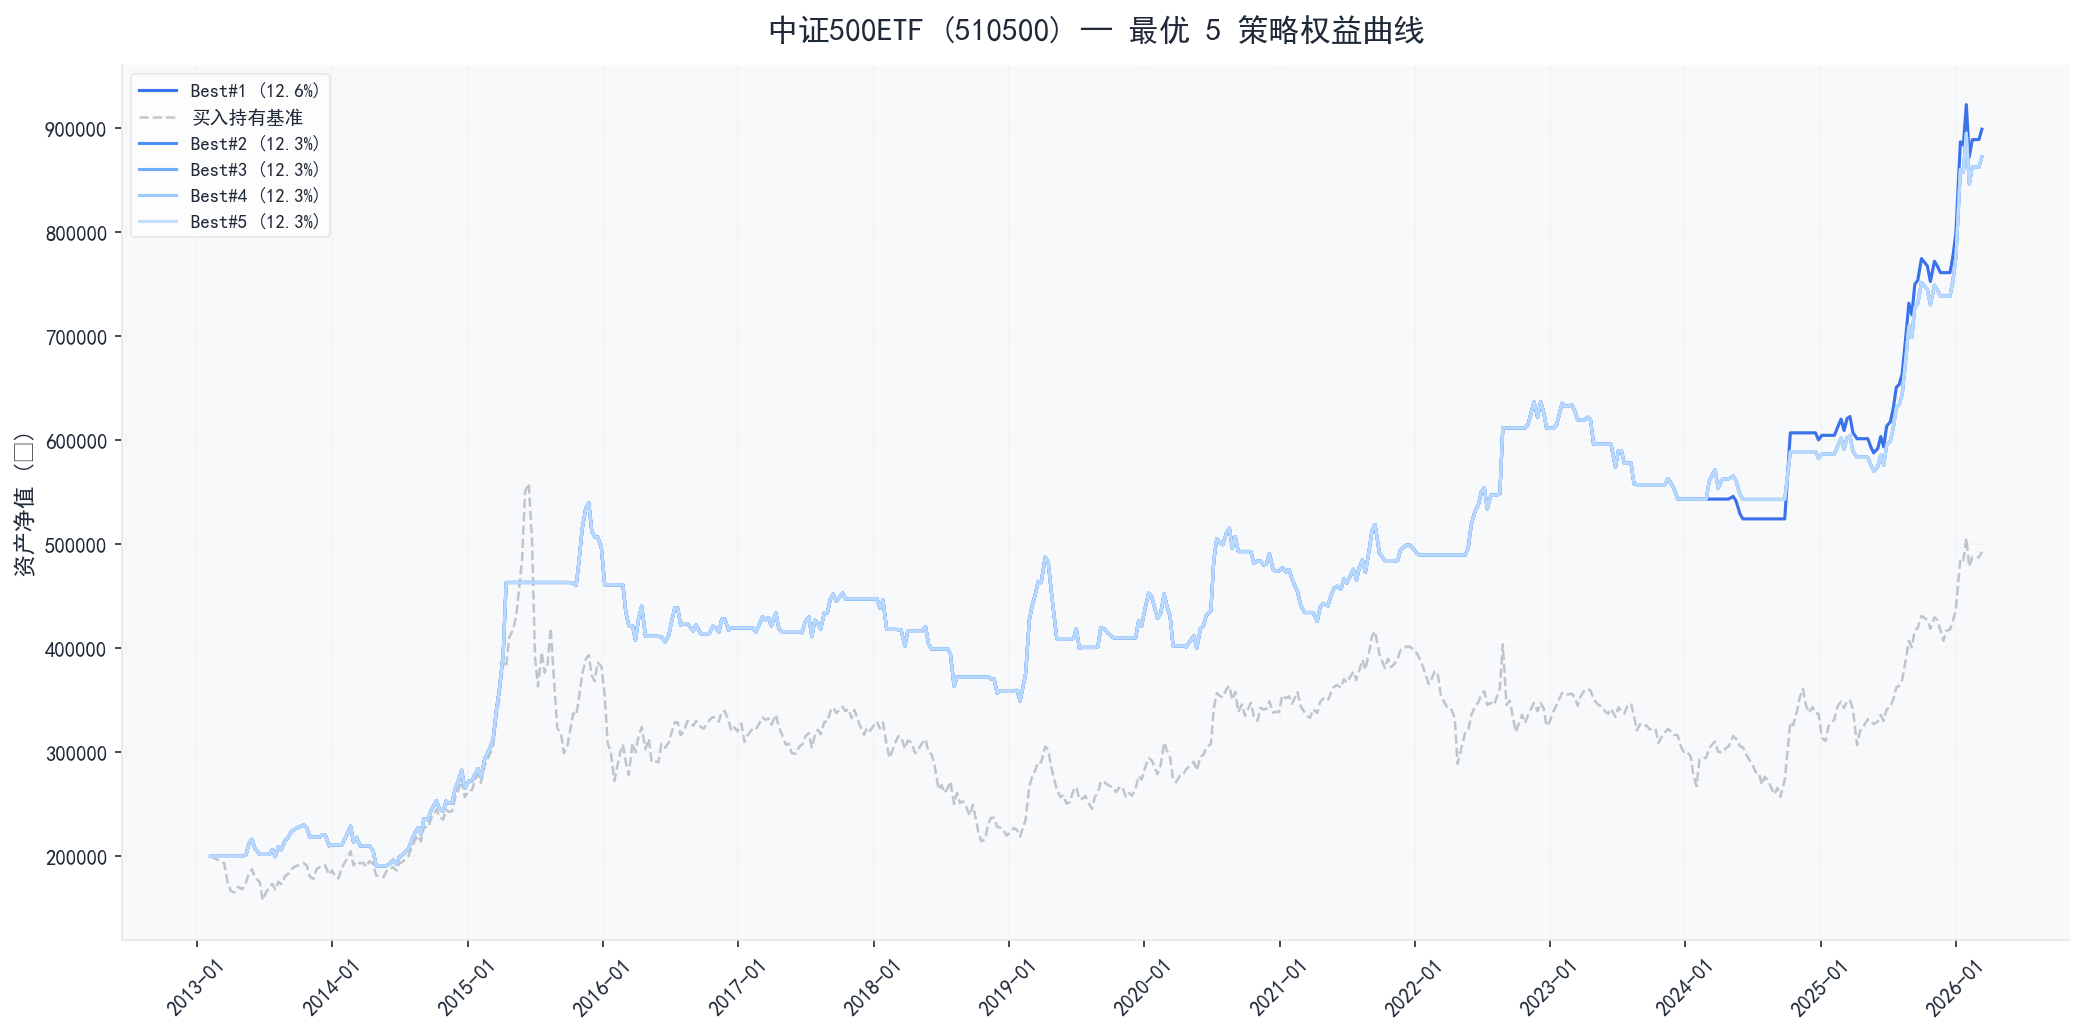
▲ 最优策略权益曲线
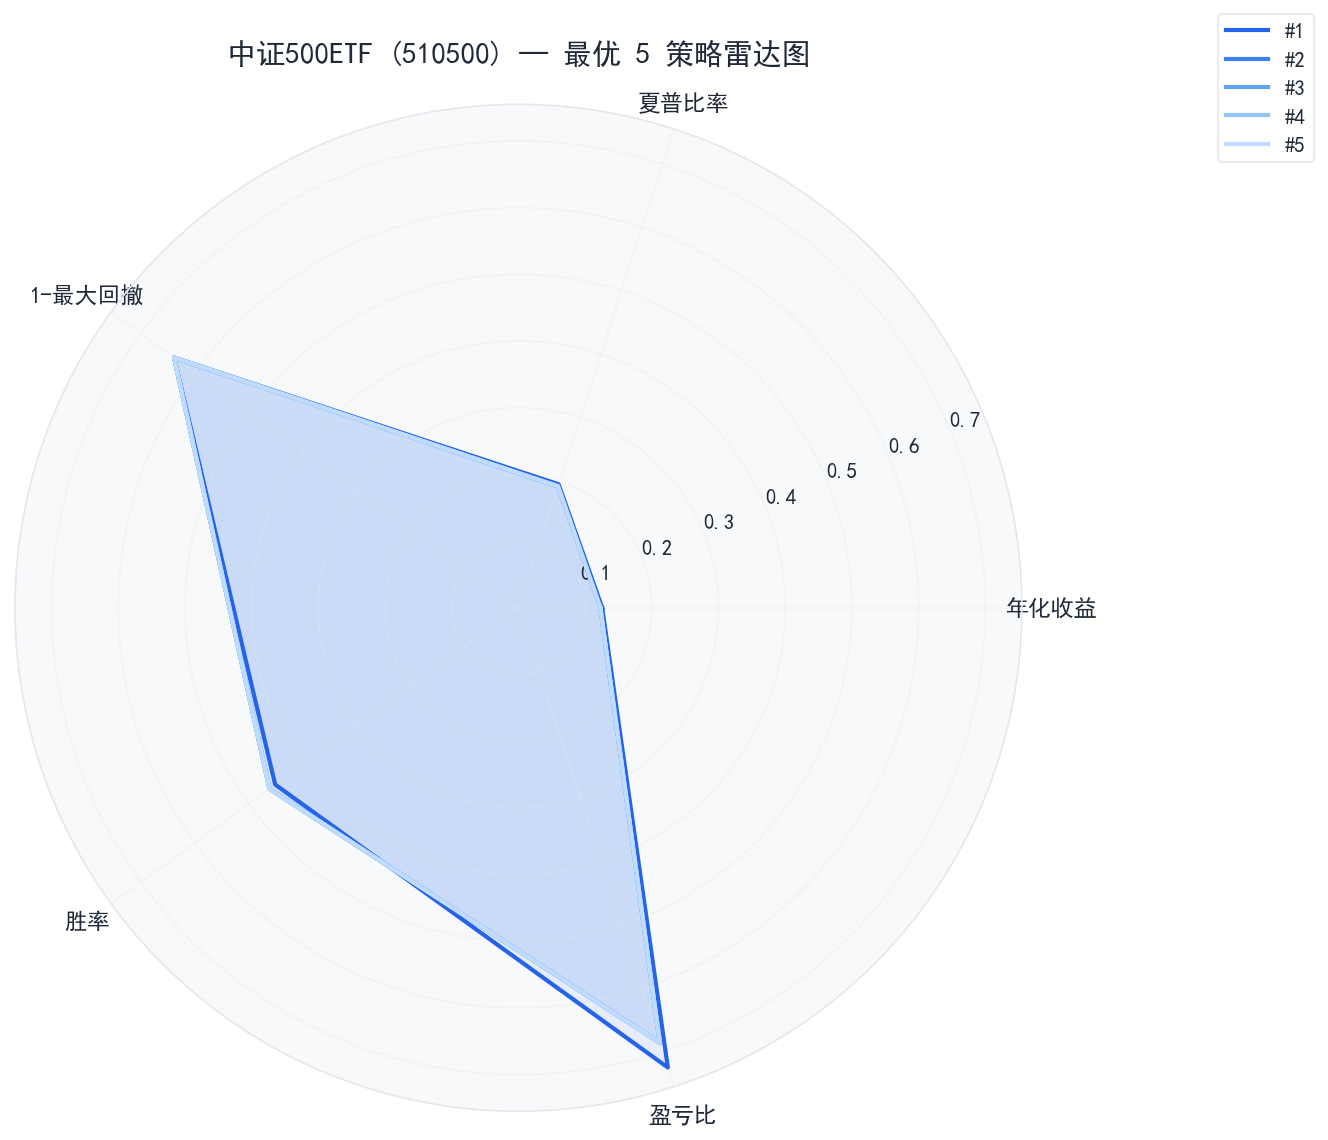
▲ 最优策略雷达图
Top 5 参数详情
- #1 — 年化 12.56% · 夏普 0.584 · 回撤 36.17%
{ "sma_long": 30, "rv_window": 10, "sma_short": 10, "bias_lower": -3.0, "bias_upper": 3.0, "enable_adx": false, "enable_atr": false, "start_year": 2013, "bias_window": 5, "bias_enabled": false, "rv_threshold": 1.5, "adx_threshold": 20, "position_base": 1.0, "position_mode": "fixed", "atr_stop_multiplier": 1.5}短期均线(10日)×月线级别(30日);中等波动率过滤;BIAS关;ATR止损关;ADX关;固定仓位(100%)
- #2 — 年化 12.29% · 夏普 0.575 · 回撤 36.17%
{ "sma_long": 30, "rv_window": 10, "sma_short": 10, "bias_lower": -3.0, "bias_upper": 8.0, "enable_adx": false, "enable_atr": false, "start_year": 2013, "bias_window": 5, "bias_enabled": true, "rv_threshold": 2.0, "adx_threshold": 20, "position_base": 1.0, "position_mode": "fixed", "atr_stop_multiplier": 1.5}短期均线(10日)×月线级别(30日);较高波动率过滤;BIAS[-3.0%,8.0%];ATR止损关;ADX关;固定仓位(100%)
- #3 — 年化 12.29% · 夏普 0.575 · 回撤 36.17%
{ "sma_long": 30, "rv_window": 10, "sma_short": 10, "bias_lower": -5.0, "bias_upper": 8.0, "enable_adx": false, "enable_atr": false, "start_year": 2013, "bias_window": 5, "bias_enabled": true, "rv_threshold": 2.0, "adx_threshold": 20, "position_base": 1.0, "position_mode": "fixed", "atr_stop_multiplier": 1.5}短期均线(10日)×月线级别(30日);较高波动率过滤;BIAS[-5.0%,8.0%];ATR止损关;ADX关;固定仓位(100%)
- #4 — 年化 12.29% · 夏普 0.575 · 回撤 36.17%
{ "sma_long": 30, "rv_window": 10, "sma_short": 10, "bias_lower": -8.0, "bias_upper": 8.0, "enable_adx": false, "enable_atr": false, "start_year": 2013, "bias_window": 5, "bias_enabled": true, "rv_threshold": 2.0, "adx_threshold": 20, "position_base": 1.0, "position_mode": "fixed", "atr_stop_multiplier": 1.5}短期均线(10日)×月线级别(30日);较高波动率过滤;BIAS[-8.0%,8.0%];ATR止损关;ADX关;固定仓位(100%)
- #5 — 年化 12.29% · 夏普 0.575 · 回撤 36.17%
{ "sma_long": 30, "rv_window": 20, "sma_short": 10, "bias_lower": -3.0, "bias_upper": 8.0, "enable_adx": false, "enable_atr": false, "start_year": 2013, "bias_window": 5, "bias_enabled": true, "rv_threshold": 2.0, "adx_threshold": 20, "position_base": 1.0, "position_mode": "fixed", "atr_stop_multiplier": 1.5}短期均线(10日)×月线级别(30日);较高波动率过滤;BIAS[-3.0%,8.0%];ATR止损关;ADX关;固定仓位(100%)
Bottom 5 最差策略
表现最差的 5 组参数组合:
| 排名 | 年化收益 | Alpha | 基准年化 | 最大回撤 | 夏普比率 | 胜率 | 年均交易 | ATR | ADX | BIAS |
|---|---|---|---|---|---|---|---|---|---|---|
| 1 | -5.50% | -12.63% | 7.13% | 51.41% | -0.847 | 0.0% | 1.0 | ✓ | ✓ | ✗ |
| 2 | -5.50% | -12.63% | 7.13% | 51.41% | -0.847 | 0.0% | 1.0 | ✓ | ✓ | ✗ |
| 3 | -5.50% | -12.63% | 7.13% | 51.41% | -0.847 | 0.0% | 1.0 | ✓ | ✓ | ✗ |
| 4 | -5.50% | -12.63% | 7.13% | 51.41% | -0.847 | 0.0% | 1.0 | ✓ | ✓ | ✗ |
| 5 | -5.50% | -12.63% | 7.13% | 51.41% | -0.847 | 0.0% | 1.0 | ✓ | ✓ | ✗ |
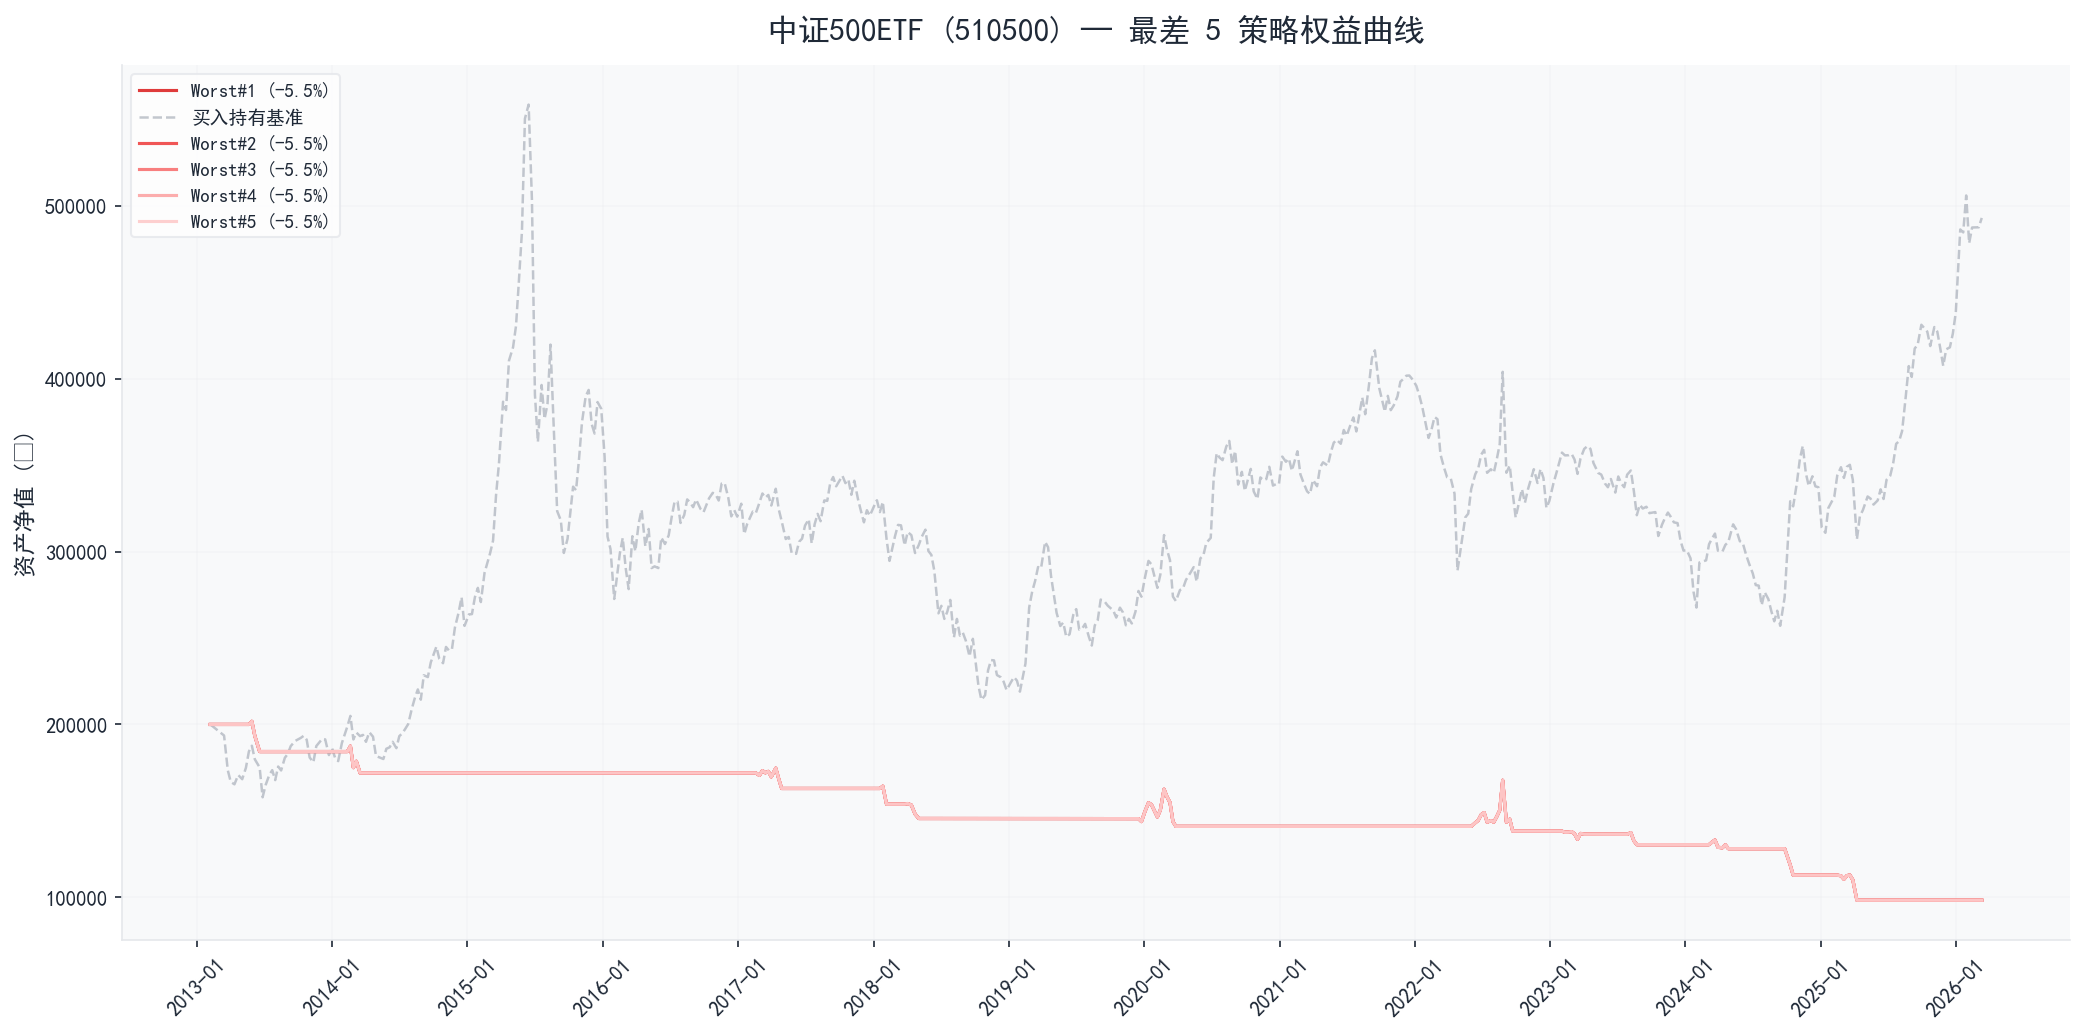
▲ 最差策略权益曲线
Bottom 5 参数详情
- #1 — 年化 -5.50% · 夏普 -0.847 · 回撤 51.41%
{ "sma_long": 50, "rv_window": 30, "sma_short": 20, "bias_lower": -3.0, "bias_upper": 3.0, "enable_adx": true, "enable_atr": true, "start_year": 2013, "bias_window": 5, "bias_enabled": false, "rv_threshold": 2.5, "adx_threshold": 20, "position_base": 1.0, "position_mode": "fixed", "atr_stop_multiplier": 3.0}短期均线(20日)×中期均线(50日);严格波动率过滤;BIAS关;ATR止损×3.0;ADX>20;固定仓位(100%)
- #2 — 年化 -5.50% · 夏普 -0.847 · 回撤 51.41%
{ "sma_long": 50, "rv_window": 30, "sma_short": 20, "bias_lower": -3.0, "bias_upper": 3.0, "enable_adx": true, "enable_atr": true, "start_year": 2013, "bias_window": 5, "bias_enabled": false, "rv_threshold": 2.0, "adx_threshold": 20, "position_base": 1.0, "position_mode": "fixed", "atr_stop_multiplier": 3.0}短期均线(20日)×中期均线(50日);较高波动率过滤;BIAS关;ATR止损×3.0;ADX>20;固定仓位(100%)
- #3 — 年化 -5.50% · 夏普 -0.847 · 回撤 51.41%
{ "sma_long": 50, "rv_window": 20, "sma_short": 20, "bias_lower": -3.0, "bias_upper": 3.0, "enable_adx": true, "enable_atr": true, "start_year": 2013, "bias_window": 5, "bias_enabled": false, "rv_threshold": 2.5, "adx_threshold": 20, "position_base": 1.0, "position_mode": "fixed", "atr_stop_multiplier": 3.0}短期均线(20日)×中期均线(50日);严格波动率过滤;BIAS关;ATR止损×3.0;ADX>20;固定仓位(100%)
- #4 — 年化 -5.50% · 夏普 -0.847 · 回撤 51.41%
{ "sma_long": 50, "rv_window": 20, "sma_short": 20, "bias_lower": -3.0, "bias_upper": 3.0, "enable_adx": true, "enable_atr": true, "start_year": 2013, "bias_window": 5, "bias_enabled": false, "rv_threshold": 2.0, "adx_threshold": 20, "position_base": 1.0, "position_mode": "fixed", "atr_stop_multiplier": 3.0}短期均线(20日)×中期均线(50日);较高波动率过滤;BIAS关;ATR止损×3.0;ADX>20;固定仓位(100%)
- #5 — 年化 -5.50% · 夏普 -0.847 · 回撤 51.41%
{ "sma_long": 50, "rv_window": 10, "sma_short": 20, "bias_lower": -3.0, "bias_upper": 3.0, "enable_adx": true, "enable_atr": true, "start_year": 2013, "bias_window": 5, "bias_enabled": false, "rv_threshold": 2.5, "adx_threshold": 20, "position_base": 1.0, "position_mode": "fixed", "atr_stop_multiplier": 3.0}短期均线(20日)×中期均线(50日);严格波动率过滤;BIAS关;ATR止损×3.0;ADX>20;固定仓位(100%)
Best vs Worst 对比分析
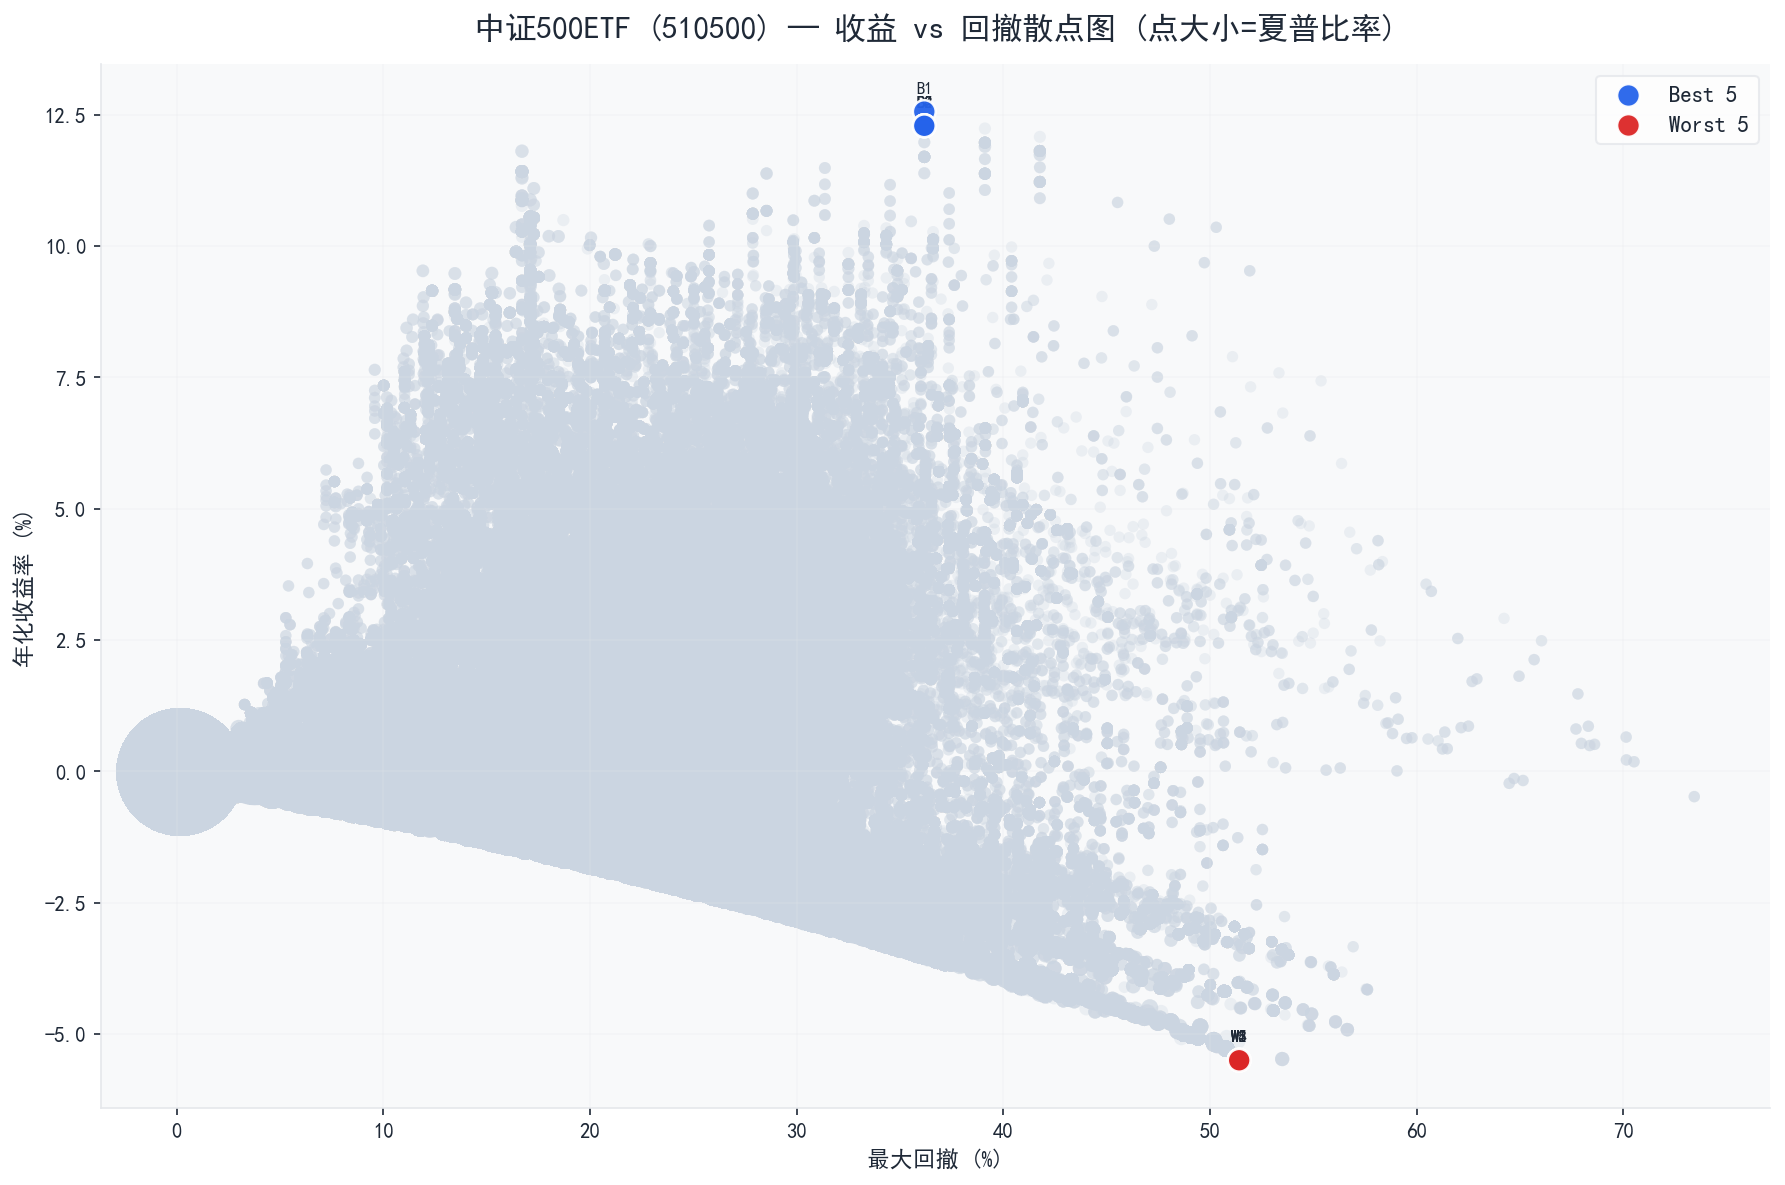
▲ 收益-回撤散点图
| 指标 | Best 5 均值 | Worst 5 均值 | 差异 |
|---|---|---|---|
| 年化收益率 | 12.34% | -5.50% | +17.84% |
| 夏普比率 | 0.577 | -0.847 | +1.424 |
| 最大回撤 | 36.17% | 51.41% | -15.24% |
| 胜率 | 45.9% | 0.0% | +45.9% |
因子敏感度分析
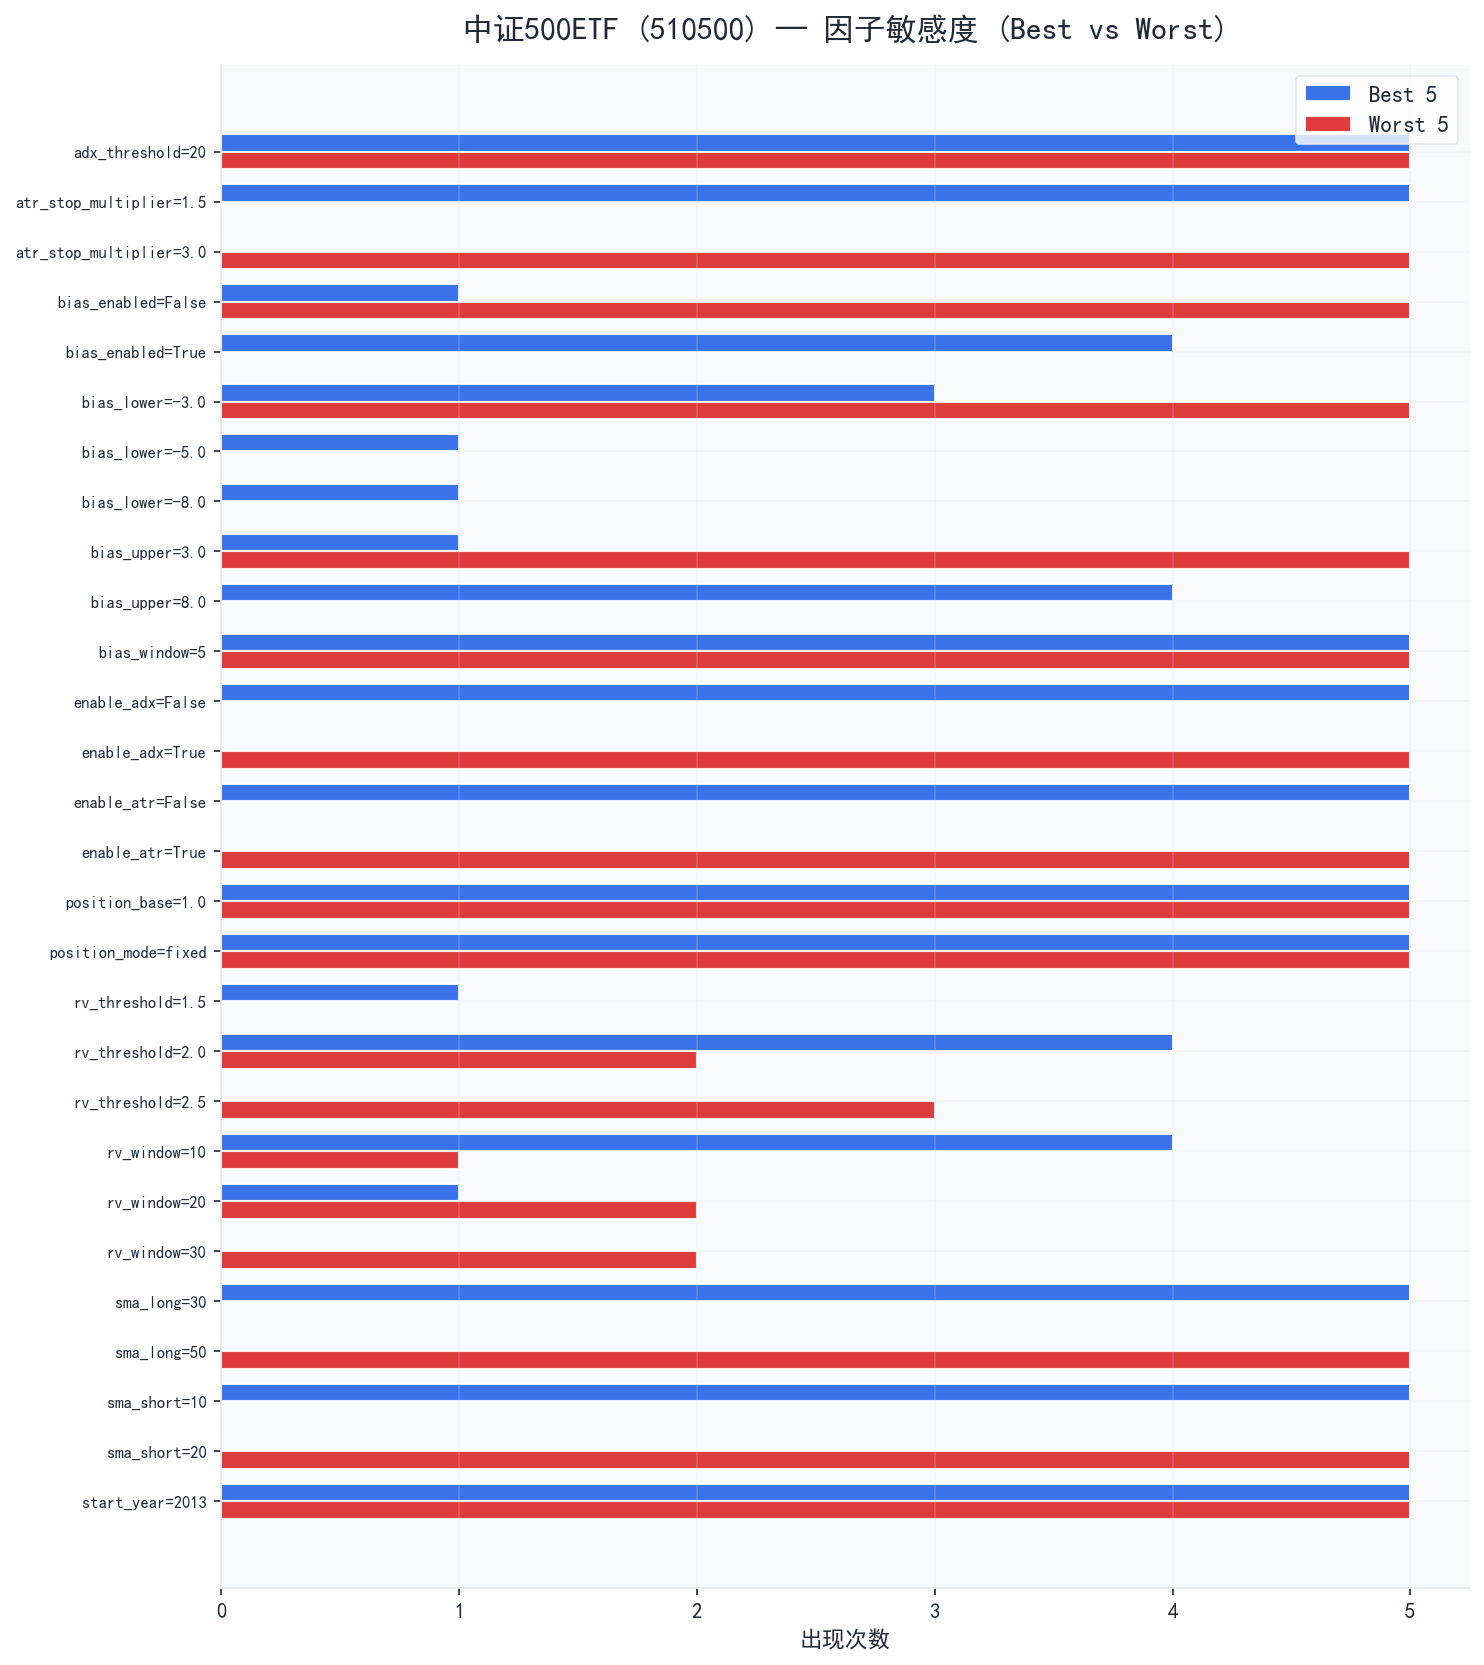
▲ 因子敏感度 最优与最差策略的因子差异:
atr_stop_multiplier: 最优策略偏好1.5,最差策略偏好3.0bias_enabled: 最优策略偏好True,最差策略偏好Falsebias_upper: 最优策略偏好8.0,最差策略偏好3.0enable_adx: 最优策略偏好False,最差策略偏好Trueenable_atr: 最优策略偏好False,最差策略偏好Truerv_threshold: 最优策略偏好2.0,最差策略偏好2.5rv_window: 最优策略偏好10,最差策略偏好30sma_long: 最优策略偏好30,最差策略偏好50sma_short: 最优策略偏好10,最差策略偏好20
最优策略交易信号
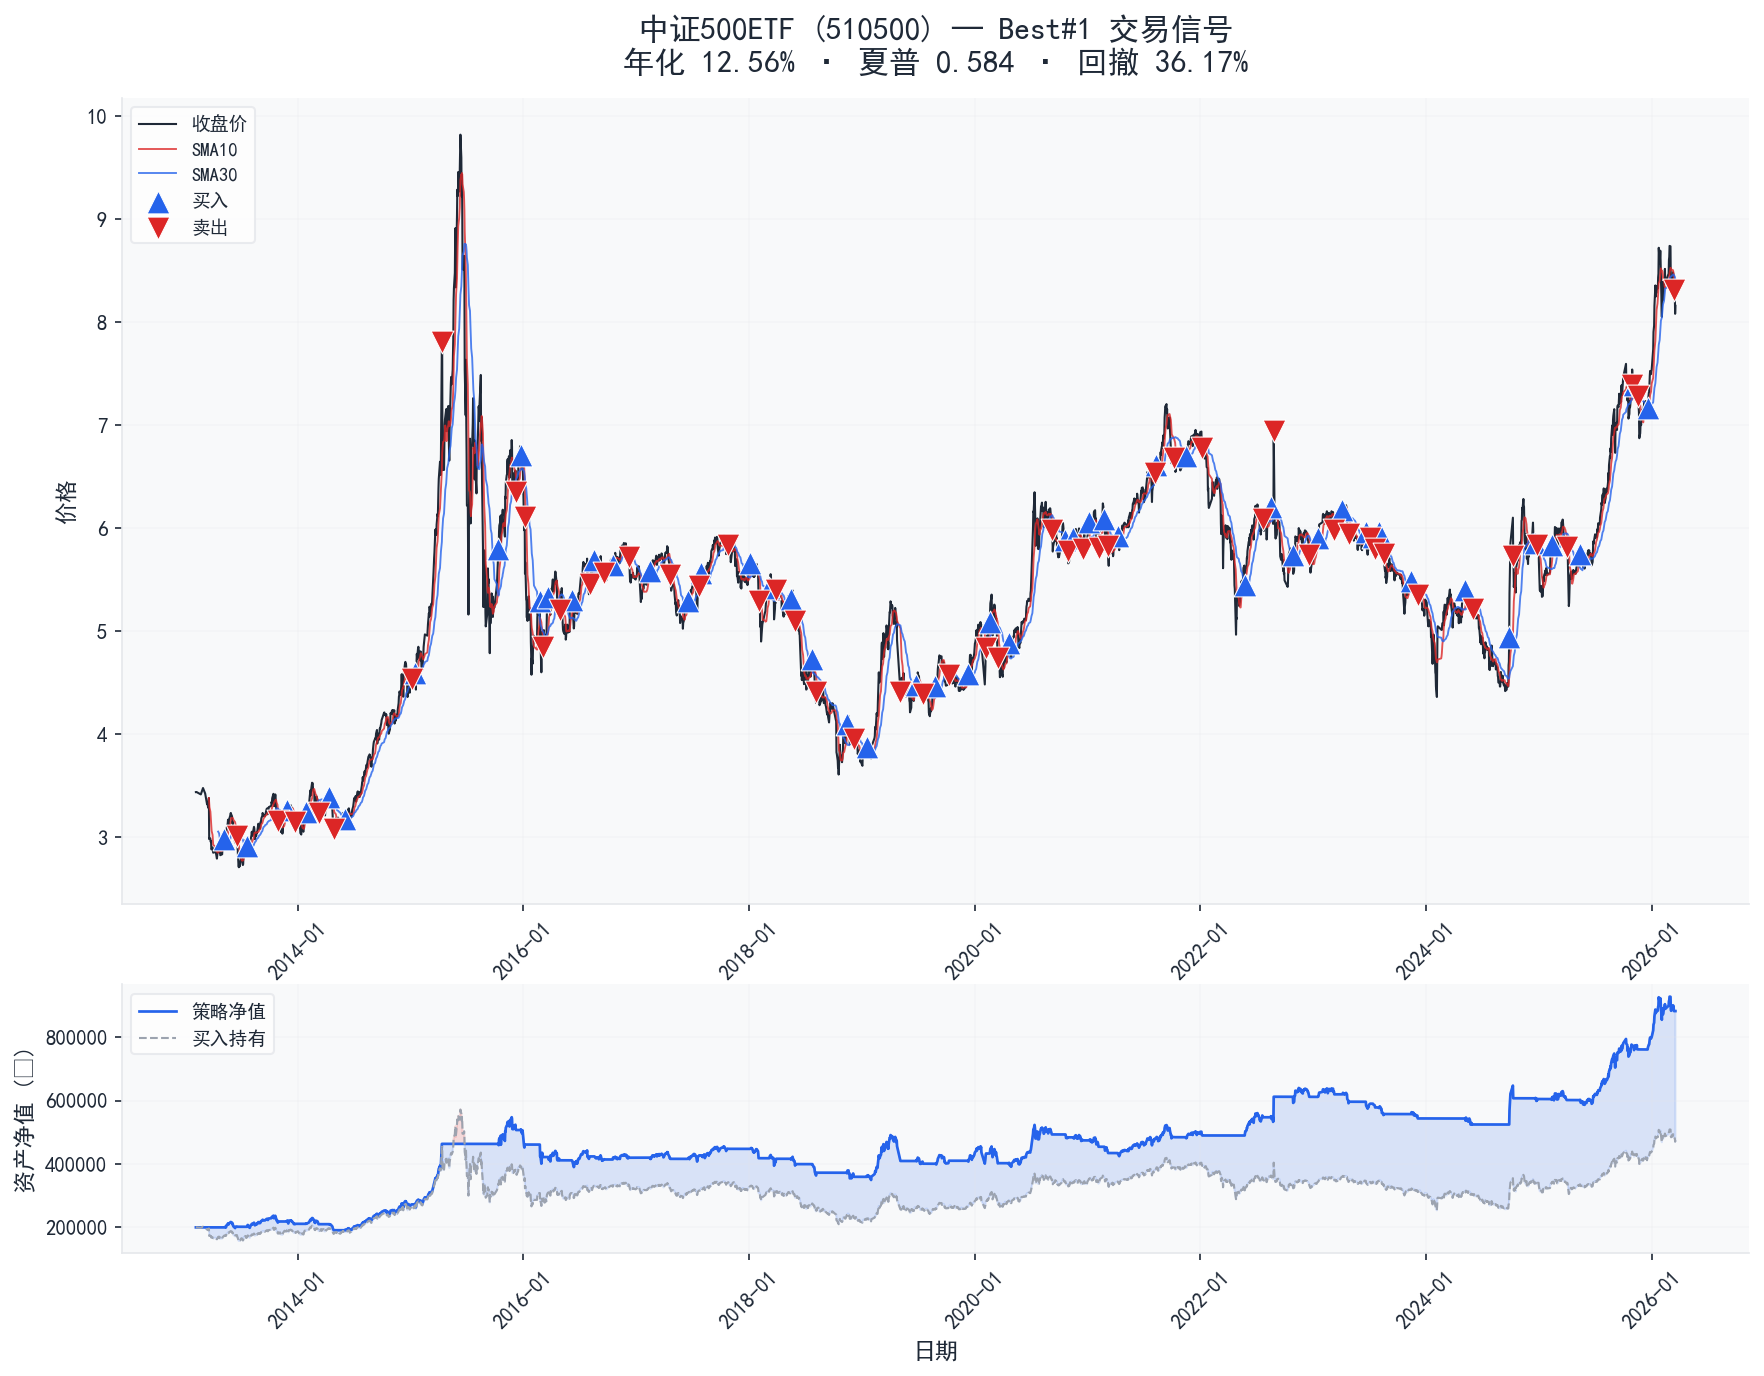
▲ 交易信号K线图
乖离率 vs 无乖离率 对比分析
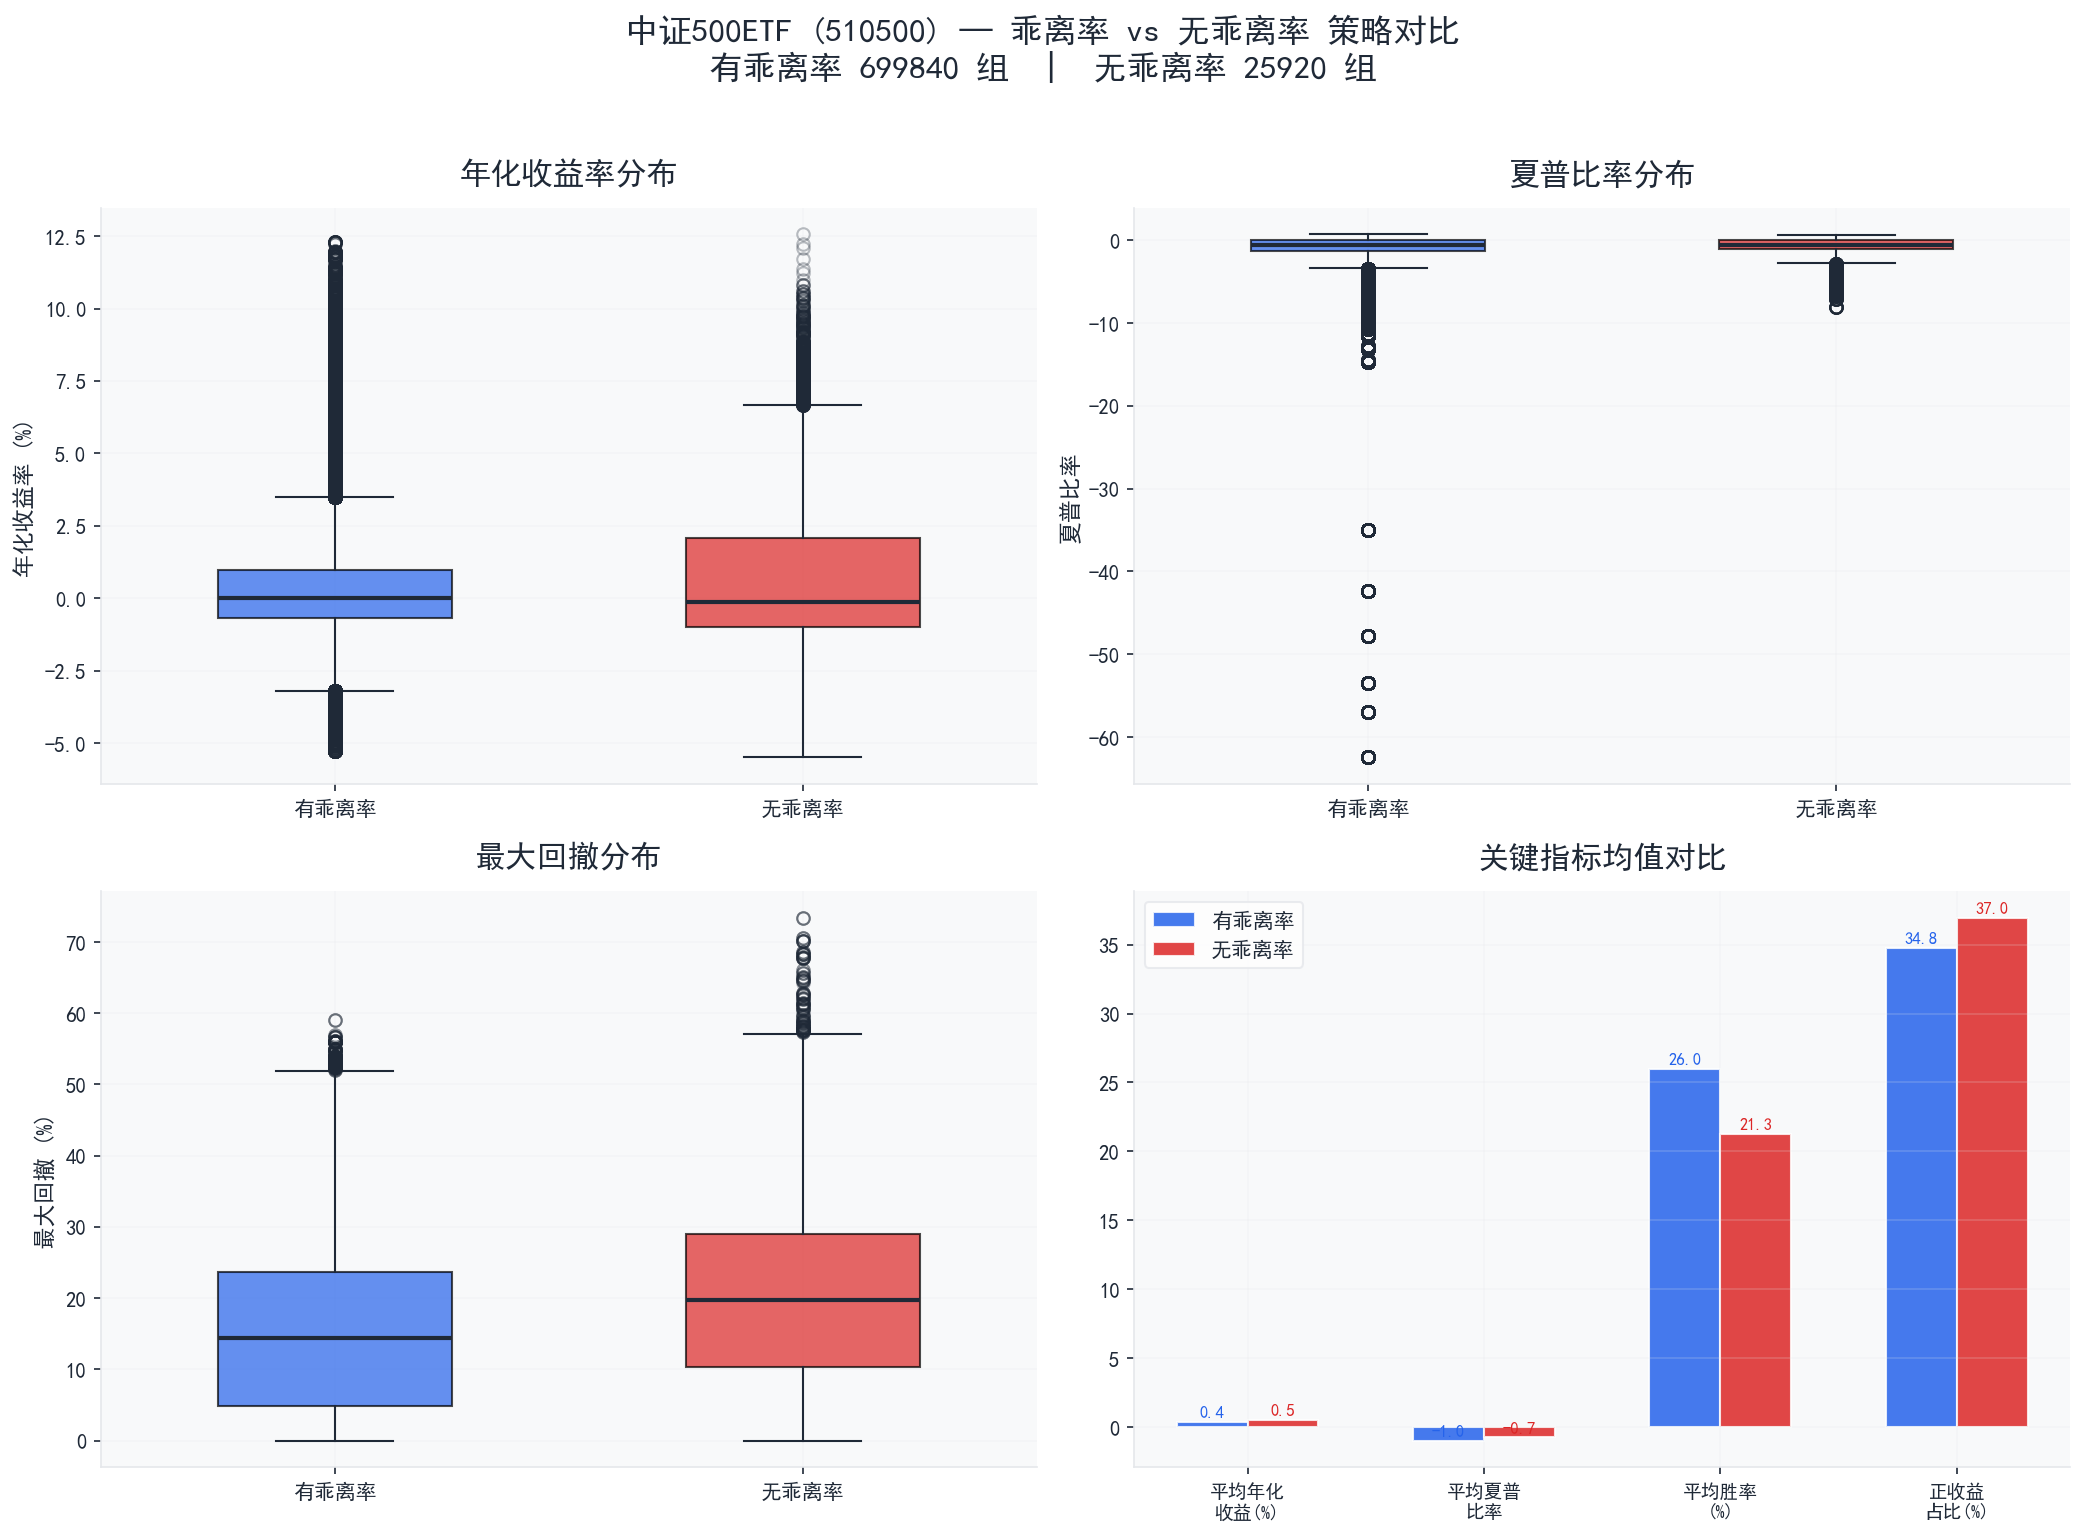
▲ 乖离率对比
| 指标 | 有乖离率 | 无乖离率 | 差异 |
|---|---|---|---|
| 组合数 | 699840 | 25920 | — |
| 平均年化收益 | 0.36% | 0.53% | -0.17% |
| 中位数年化收益 | 0.00% | -0.14% | +0.14% |
| 最高年化收益 | 12.29% | 12.56% | -0.27% |
| 平均夏普比率 | -0.981 | -0.747 | -0.234 |
| 平均最大回撤 | 14.95% | 20.07% | -5.12% |
| 平均胜率 | 26.0% | 21.3% | +4.7% |
| 正收益占比 | 34.8% | 37.0% | -2.2% |
| 平均交易次数 | 12.4 | 14.1 | -1.7 |
分析结论:
- 两组平均年化收益差异不大,乖离率对收益的影响有限
- 有乖离率组平均回撤低 5.12%,乖离率在风控方面发挥了积极作用
- 无乖离率组风险调整后收益更优,夏普比率高出 0.234
模块消融分析 (ATR止损 × ADX过滤)
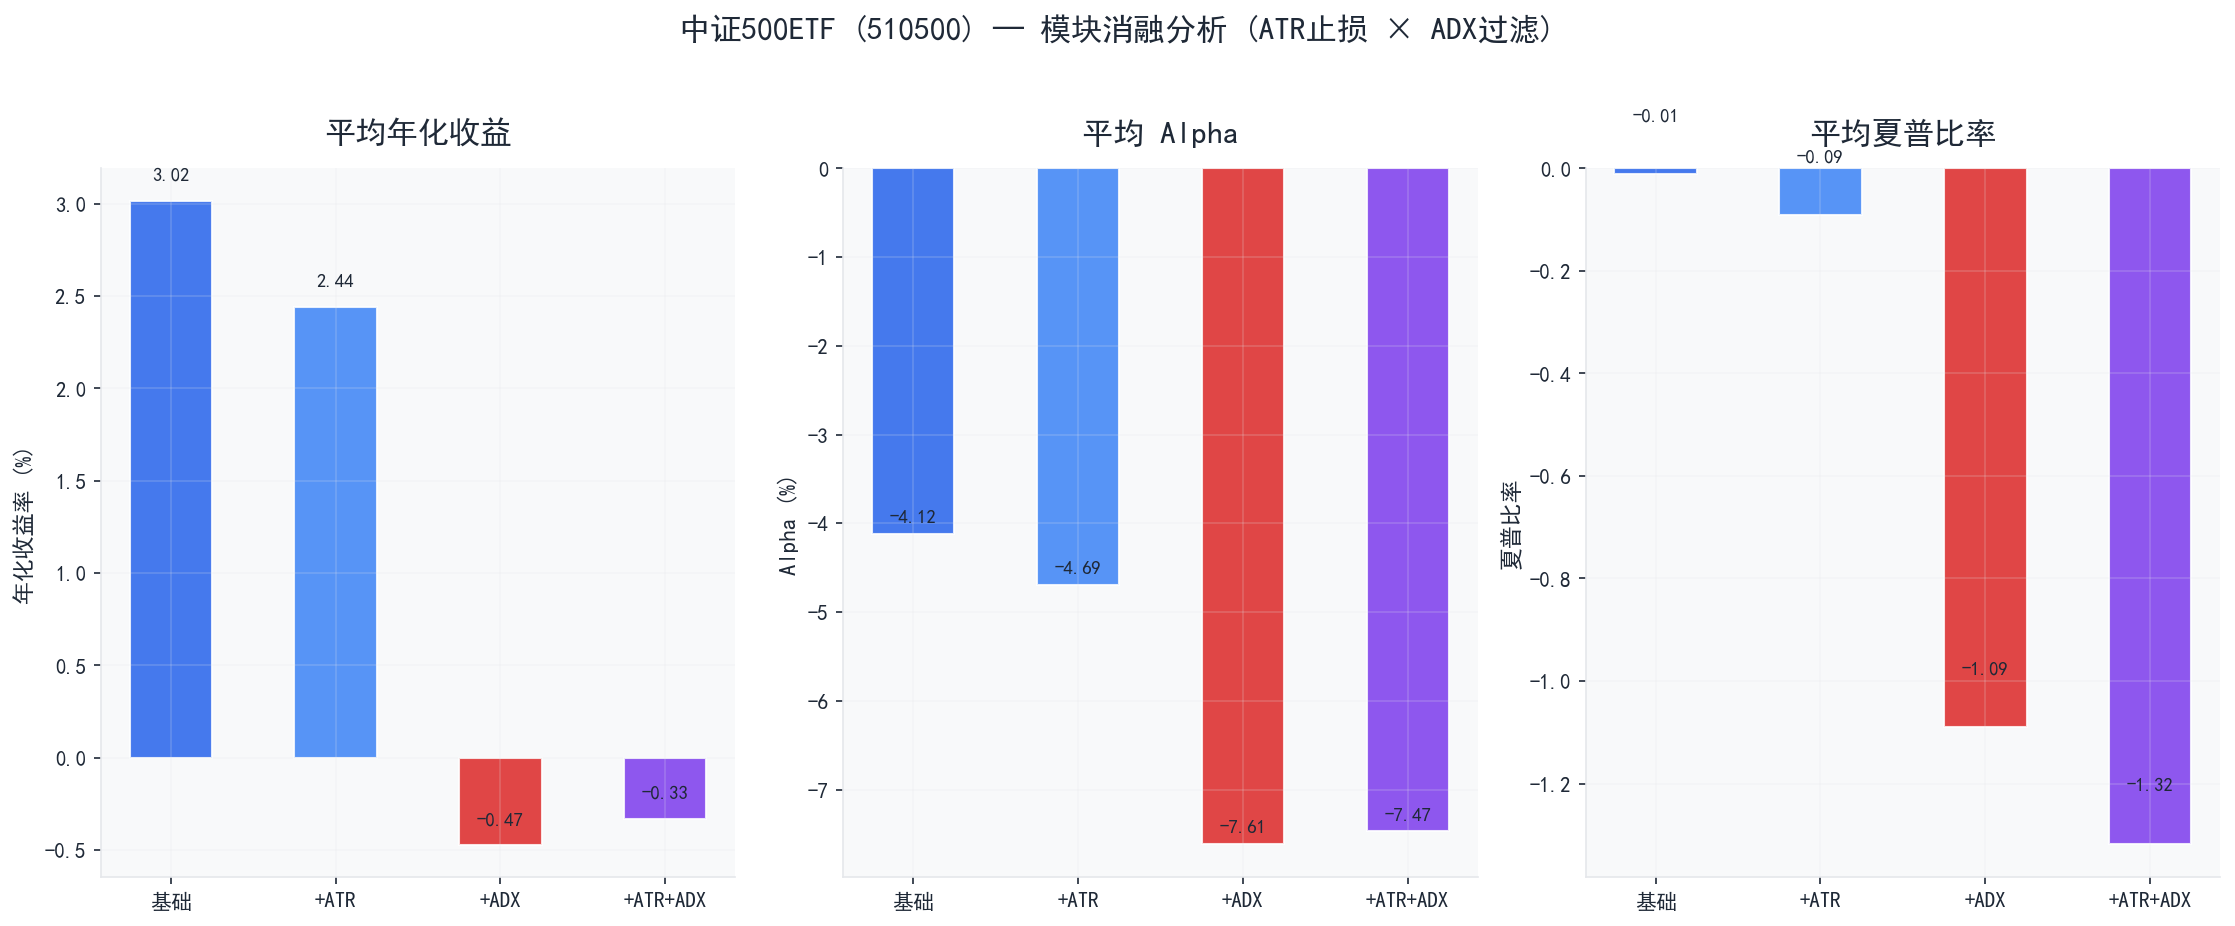
▲ 模块消融对比
| 模块组合 | 组合数 | 平均年化 | 平均Alpha | 平均夏普 | 平均回撤 | 正收益占比 |
|---|---|---|---|---|---|---|
| 基础策略 | 36288 | 3.02% | -4.12% | -0.010 | 24.17% | 88.4% |
| +ATR止损 | 145152 | 2.44% | -4.69% | -0.090 | 24.54% | 79.6% |
| +ADX过滤 | 108864 | -0.47% | -7.61% | -1.090 | 14.33% | 19.8% |
| +ATR+ADX | 435456 | -0.33% | -7.47% | -1.317 | 11.45% | 19.2% |
结论与建议
创业板ETF (159915) 推荐配置
{ "sma_long": 30, "rv_window": 10, "sma_short": 20, "bias_lower": -3.0, "bias_upper": 3.0, "enable_adx": false, "enable_atr": true, "start_year": 2013, "bias_window": 5, "bias_enabled": false, "rv_threshold": 2.5, "adx_threshold": 20, "position_base": 1.0, "position_mode": "fixed", "atr_stop_multiplier": 2.0}| 指标 | 数值 |
|---|---|
| 年化收益 | 17.50% |
| Alpha | +4.52% |
| 基准年化 | 12.98% |
| 最大回撤 | 40.98% |
| 夏普比率 | 0.652 |
| 胜率 | 52.5% |
沪深300ETF (510300) 推荐配置
{ "sma_long": 120, "rv_window": 20, "sma_short": 20, "bias_lower": -3.0, "bias_upper": 3.0, "enable_adx": false, "enable_atr": true, "start_year": 2013, "bias_window": 5, "bias_enabled": false, "rv_threshold": 2.5, "adx_threshold": 20, "position_base": 1.0, "position_mode": "fixed", "atr_stop_multiplier": 1.5}| 指标 | 数值 |
|---|---|
| 年化收益 | 9.54% |
| Alpha | +2.75% |
| 基准年化 | 6.79% |
| 最大回撤 | 34.73% |
| 夏普比率 | 0.477 |
| 胜率 | 37.5% |
中证500ETF (510500) 推荐配置
{ "sma_long": 30, "rv_window": 10, "sma_short": 10, "bias_lower": -3.0, "bias_upper": 3.0, "enable_adx": false, "enable_atr": false, "start_year": 2013, "bias_window": 5, "bias_enabled": false, "rv_threshold": 1.5, "adx_threshold": 20, "position_base": 1.0, "position_mode": "fixed", "atr_stop_multiplier": 1.5}| 指标 | 数值 |
|---|---|
| 年化收益 | 12.56% |
| Alpha | +5.42% |
| 基准年化 | 7.13% |
| 最大回撤 | 36.17% |
| 夏普比率 | 0.584 |
| 胜率 | 45.1% |
风险提示
- 历史回测不代表未来表现,策略的有效性可能随市场结构变化而失效
- 回测未考虑滑点、涨跌停限制等实际交易摩擦
- 建议使用多标的、多时间段交叉验证后再投入实盘
- 实盘建议从小仓位开始,逐步验证策略有效性
API 调用示例
from api.strategy_api import get_best_strategy, run_strategy_signal
# 获取最优策略best = get_best_strategy("159915")print(best)
# 实盘信号生成signal = run_strategy_signal( ticker="159915", factor_config=best['factor_config'], latest_data=latest_df,)print(signal)本报告由 stickman.life 策略研究系统自动生成
文章分享
如果这篇文章对你有帮助,欢迎分享给更多人!